Timeline and Playback
When a strategy has been backtested using Full Analysis, Time-Based Analysis, or Trade-Level Analysis mode, the analysis screen gains a detailed visualisation of the decision-making process over time. The time slider, price chart, and playback controls work together to let you navigate to any moment during the strategy execution and inspect the state of every rule and trade at that point.
Time Slider
The time slider is located at the top of the analysis screen. It represents the full duration of the strategy execution and provides a fast way to move near to a particular point of interest.
As you move the slider, the entire analysis screen updates to reflect the state of the strategy at that position in the timeline. The rules on the canvas, the trade markers, and the price chart are all synchronised to the selected time.
The time slider is best used for quickly navigating to a region of interest — for example, jumping to the middle of the execution or moving to a period where you noticed unusual results. For more precise navigation, use the playback controls or the rule-specific navigation buttons.
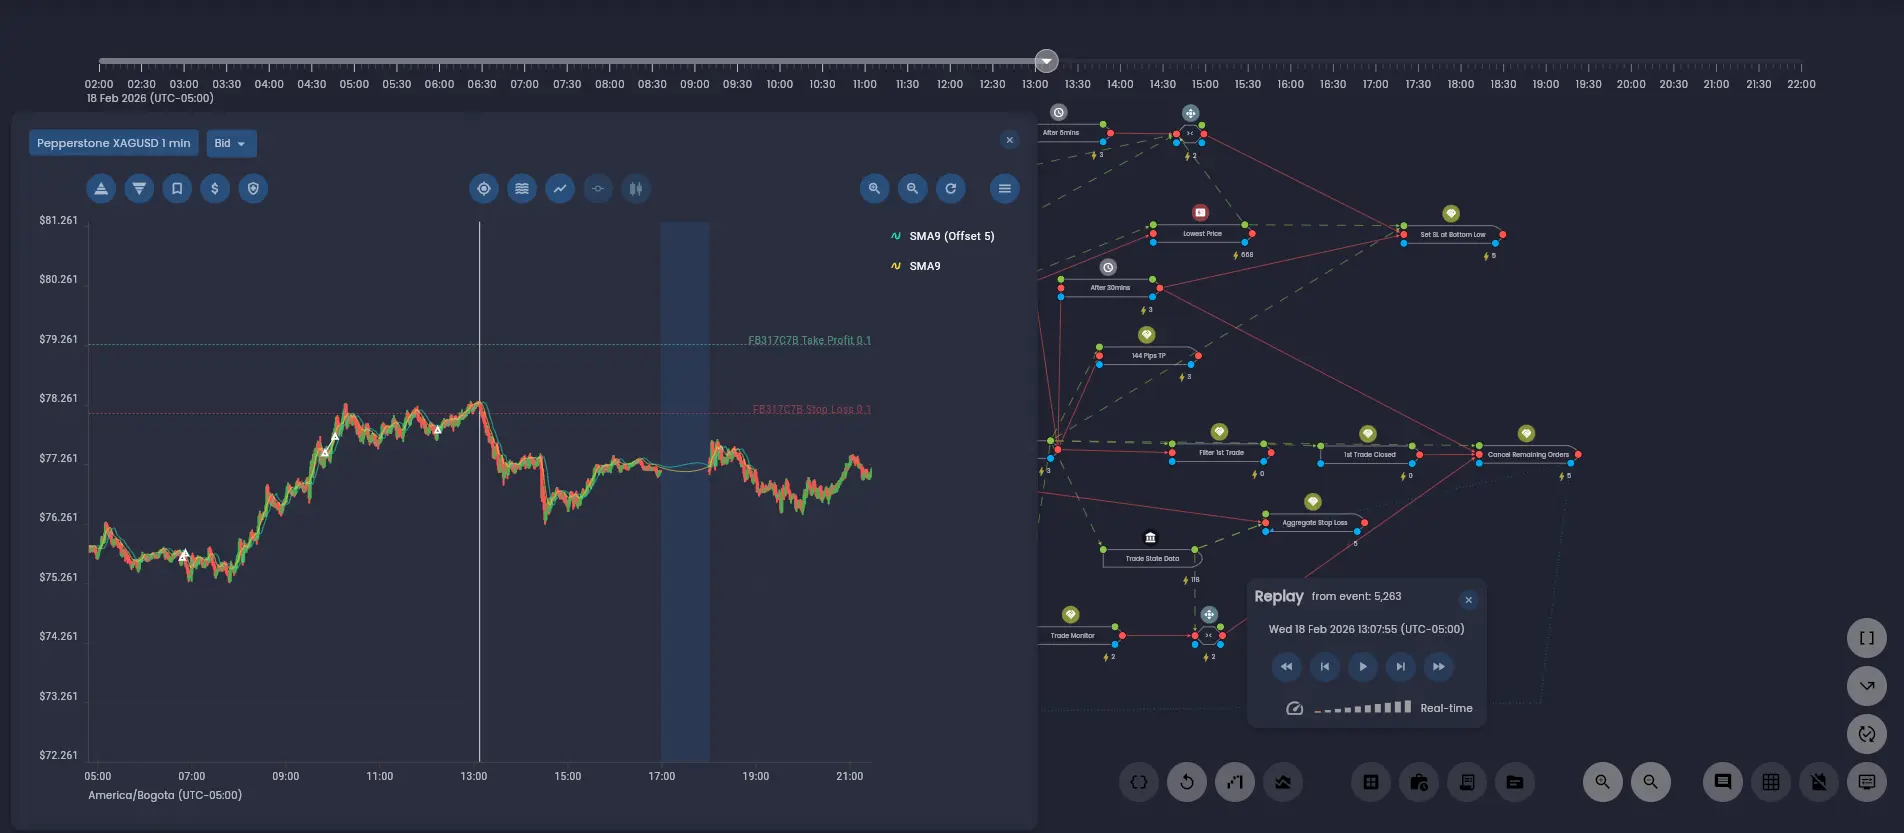
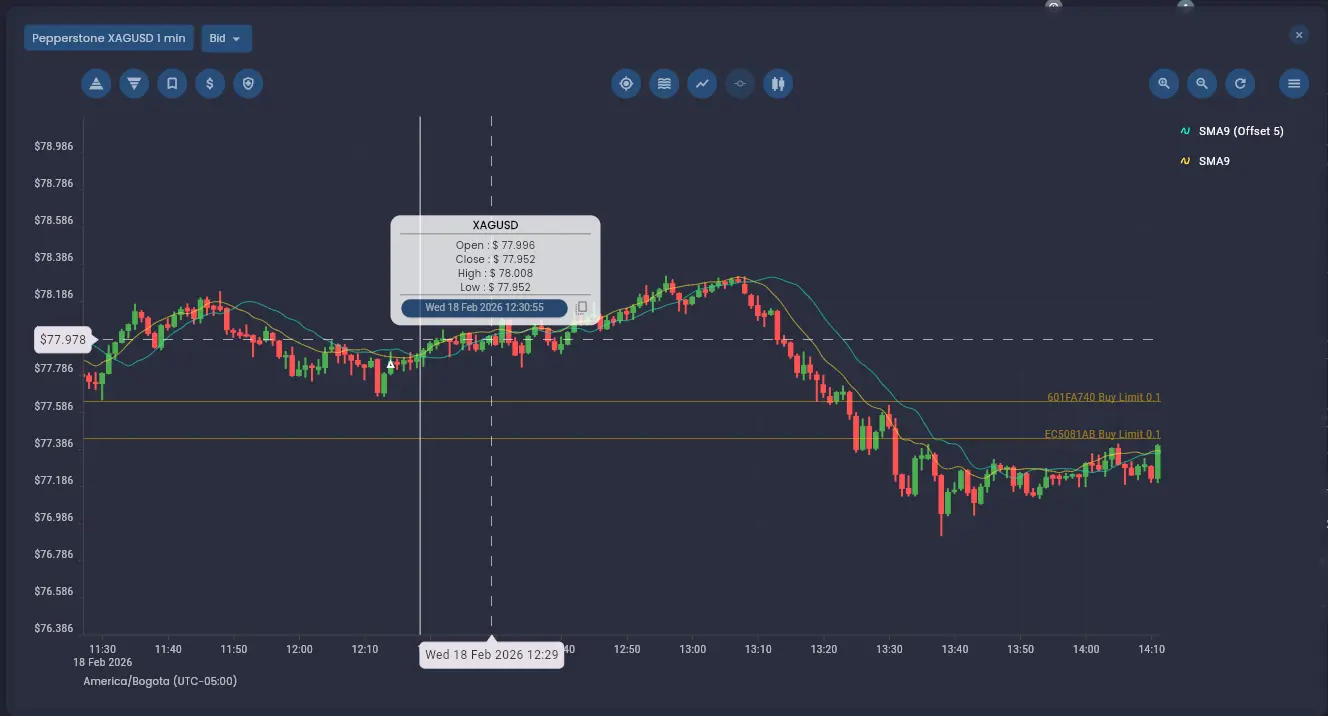
Price Chart
When using a higher fidelity analysis mode, the price chart gains additional navigation features beyond the basic view available in final state analysis.
Time Position Line
A vertical line on the price chart shows the current time position of the strategy state. This line moves as you navigate through the timeline using the time slider, playback controls, or rule-specific navigation.
Click to Jump
You can click the tooltip time for a candle or a trade marker on the chart to jump directly to that specific moment in the timeline. When you do, the rules, trades, and the rest of the analysis screen are all updated to reflect the state of the strategy at that point in time.
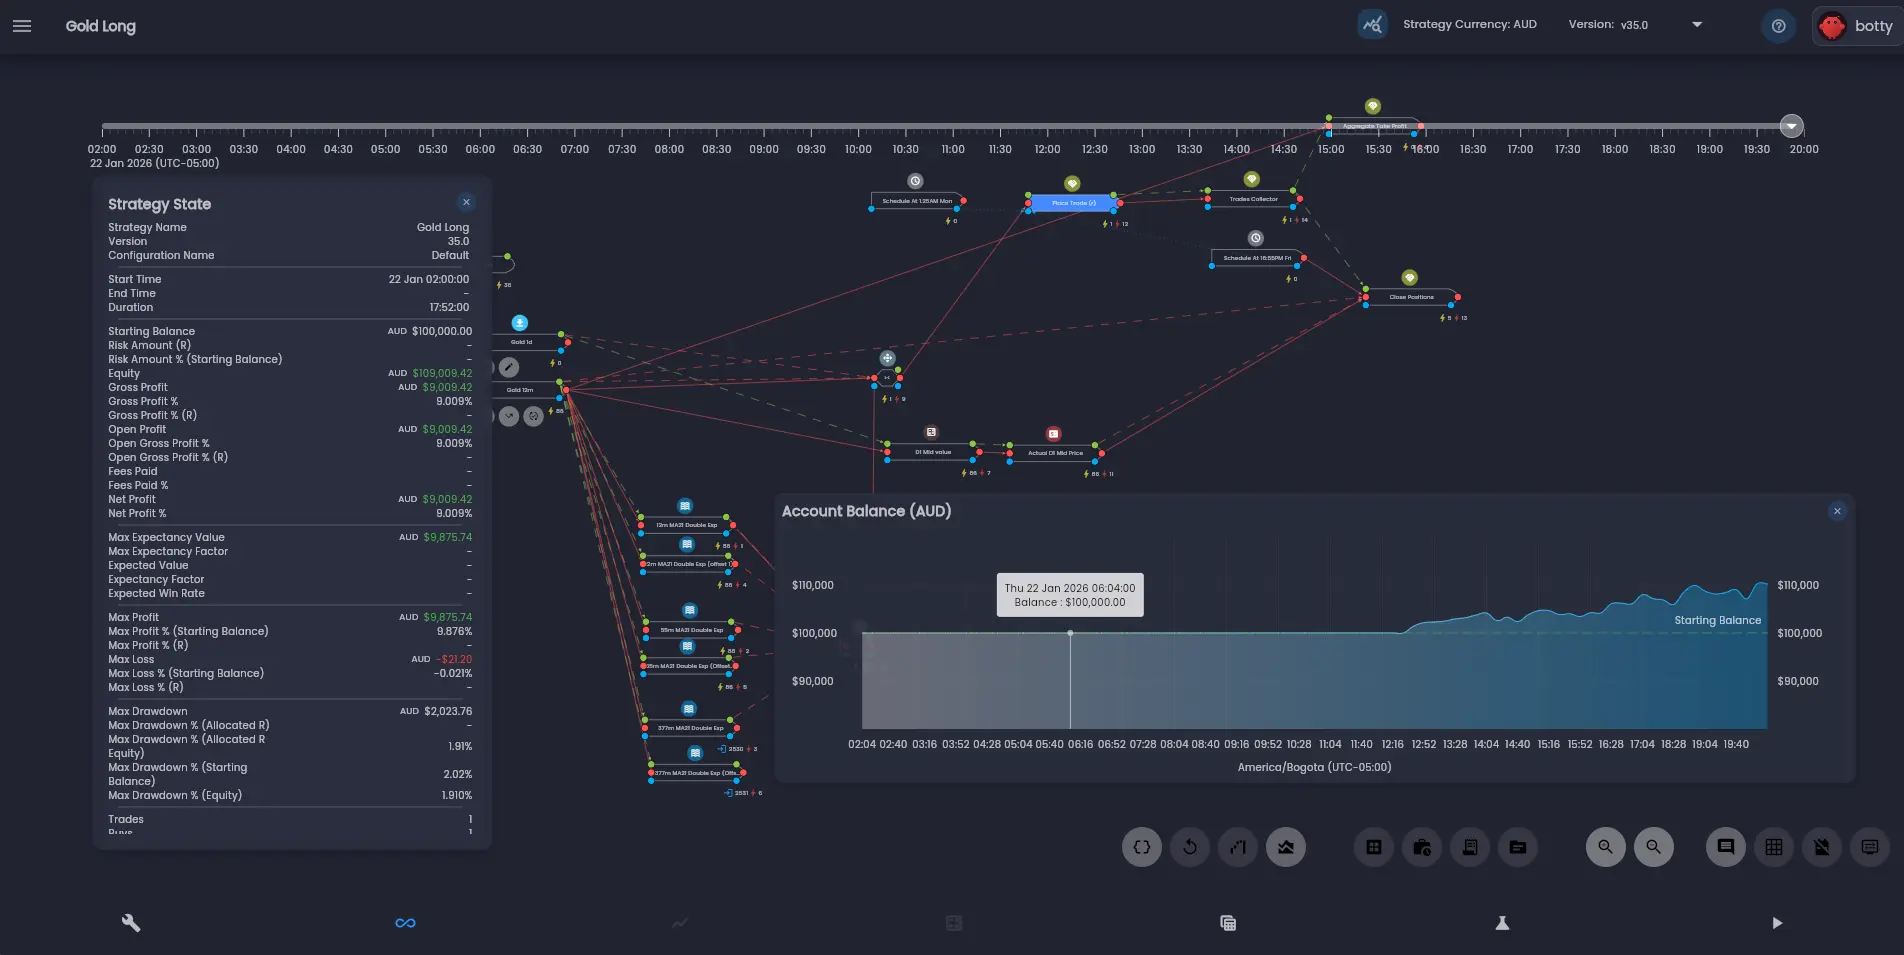
Equity Chart
The equity chart displays the cumulative account equity over the course of the strategy execution. It provides a visual representation of how the account balance changed over time, making it easy to identify periods of growth, drawdown, or flat performance at a glance.
Playback Controls
The playback controls dialog can be opened by clicking  . The controls allow you to replay the strategy execution
at various speeds, and move forward or backward through the strategy execution one state event at a time.
. The controls allow you to replay the strategy execution
at various speeds, and move forward or backward through the strategy execution one state event at a time.
Stepping Through Events
Use the step forward and step backward buttons to move through the strategy execution one state event at a time. As you step through each event, the chart, all rule panels, and trade data update in perfect synchrony — providing a complete snapshot of the strategy at that moment.
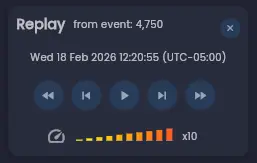
Playback Speed
You can increase or decrease the speed at which you move forward or backward through the strategy. The speed multiplier groups state events together during navigation, allowing you to cover more ground quickly when you need to move through a large number of events.
Event Counter
Keep an eye on the "from event" counter to see how many events forward or backward you have moved from your reference position. The number of events between captures will vary based on the rules executed in each cycle of the rules engine and the fidelity of the analysis mode.
State Events
A state event refers to a full cycle of the rules engine execution. Each state event encapsulates the complete computational state of the strategy at that moment — including all rules that were triggered and all data transformations that occurred. A rules engine execution cycle is triggered by an external input;
- A data source event — A new price update received by a price data rule.
- A time-based trigger — A periodic rule evaluation based on a configured schedule.
- A trade event — An order fill, cancellation, or other transactional event received that triggers a trade monitor rule.
Typically there are a large number of individual internal events generated by rules executing and trades updating within a single rules engine cycle. The state event captures a snapshot of the system state after all updates have been actioned following the latest external event — this makes the state event extremely powerful for debugging and analysis.
Analysis Mode Resolution
The analysis mode you choose when running a backtest determines how frequently the strategy state is captured, and therefore how many state events are available for navigation.
| Mode | What Is Captured | Resolution |
|---|---|---|
| Full Analysis | State after every cycle of the rules engine | Highest — every external event produces a navigable state |
| Time-Based Analysis | State at regular, user-defined intervals | Medium — multiple execution cycles may occur between captured states |
| Trade-Level Analysis | State only when key trade events occur | Lowest — state is captured at trade milestones only |
Full Analysis mode records every state transition, including all rule executions, data transformations, and responses to incoming market data. This yields a complete and continuous temporal reconstruction of the strategy's behaviour, ideal for detailed debugging. However, due to the volume of state data captured, this mode incurs the highest computational and storage overhead.
Time-Based Analysis mode captures the strategy state at regular, user-defined intervals. More execution cycles will complete between captured states compared to Full Analysis, meaning some intermediate transitions are not individually navigable. This offers a balance between resolution and performance.
Trade-Level Analysis mode captures state only when key trade-related events occur — such as the opening or closing of a position, or the placement or cancellation of an order. This is the most efficient mode in terms of runtime and data storage.
Use Full Analysis mode when you need to debug the precise sequence of events that led to a specific decision. Use Time-Based or Trade-Level mode when you want to review strategy behaviour over a longer period without the overhead of capturing every state transition.
Rule-Specific Navigation
In addition to the time slider and playback controls, the analysis screen supports navigation that is specific to individual rules.
Each Rule State View includes execution jump controls:
- Next Execution — Jump forward in the timeline to the next time this specific rule fired.
- Previous Execution — Jump backward in the timeline to the previous time this rule fired.
When you use these controls, the entire interface — including the timeline, chart, and all open rule panels — synchronises to that moment. This enables cause-and-effect tracing for specific rule behaviour and is particularly useful when you want to iterate through every execution of a particular rule without stepping through unrelated events in between.
You can keep multiple Rule State Views open while navigating, allowing you to track the evolution of several rules simultaneously as you move through the strategy's progression.
Navigating Execution Dependencies
Moving through the timeline allows you to view the evaluated execution dependencies for a rule at any point in time. Each condition is displayed as true or false based on the state at the current timeline position.
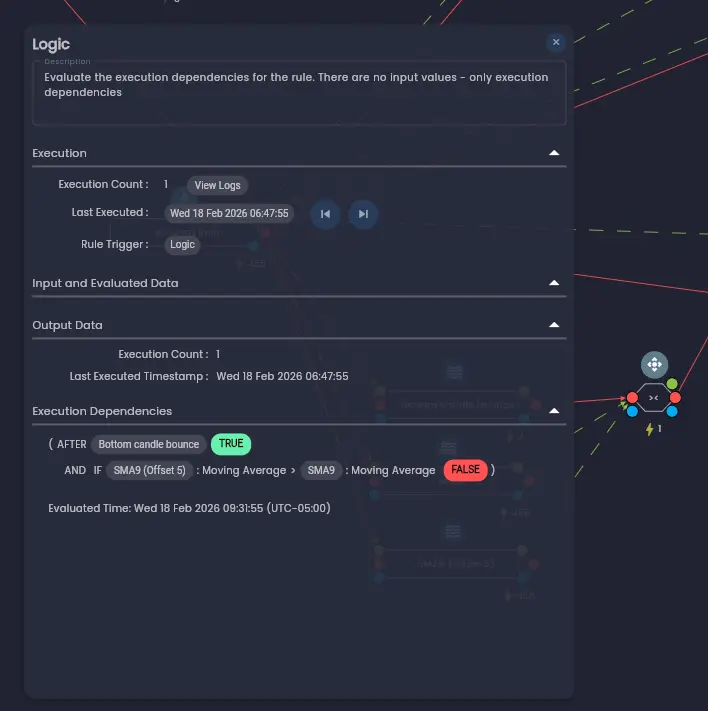
This can be especially useful to investigate why a rule did not execute — by stepping to a moment where you expected the rule to fire, you can see which dependency conditions were not met and trace back to the source rules responsible.
Was this helpful? Let us know