Running Your First Backtest
Now that you have built a strategy, it is time to test it against historical data. This tutorial walks you through configuring a backtest, launching it, and interpreting the results. By the end you will understand how to evaluate whether a strategy is worth pursuing further.
Hypothetical results disclaimer: Backtest results are based on historical data and represent hypothetical performance. Past performance does not guarantee future results. Real trading involves risks including slippage, liquidity gaps, and market conditions that may differ from historical simulations. Always use backtest results as one input in your decision-making process, not as a guarantee of future profitability.
Prerequisites
Before proceeding, make sure you have:
- A saved strategy ready to test. If you followed the previous tutorial, you should have the MA Crossover Demo strategy available with its SMA 20/50 entry logic, close positions exit logic and 15,000-pip stop loss on XAUUSD.
- Familiarity with the platform layout from the Platform Overview.
Step 1: Navigate to BackTesting
From the Strategy Designer there is a 'flask' icon in the bottom navigation bar. Click this to open the backtest configuration page where you set up all the parameters for your simulation.
You can navigate to the backtesting configuration page from anywhere that you see the 'flask' icon. This is useful after analysing a backtest or strategy result as you can you can re-use the configuration from a previous backtest.
Step 2: Configure BackTesting Details
The configuration page is divided into several sections, each controlling a different aspect of how the backtest will run.
The BackTesting Details section at the top of the page is where you select which strategy to test and set the account parameters.
- Strategy — The Strategy is already selected as you have navigated from the context of the
MA Crossover Demostrategy. - Version — Select
Latestto use the most recent saved version of the strategy. You can also select a specific version number if you want to test an earlier version of the strategy or re-run a backtest that has previously been run. - Configuration — Leave as
Default. Strategy Configurations allow you to use alternative parameter sets for the same strategy. - Demo Broker balance — Set the starting account balance for account used in strategy for
the simulation. For this
tutorial, set it to
100,000.00. - Leverage — Set the leverage ratio. The default is
30:1, which is standard for forex instruments like XAUUSD. You can adjust this to match your broker's actual leverage settings.
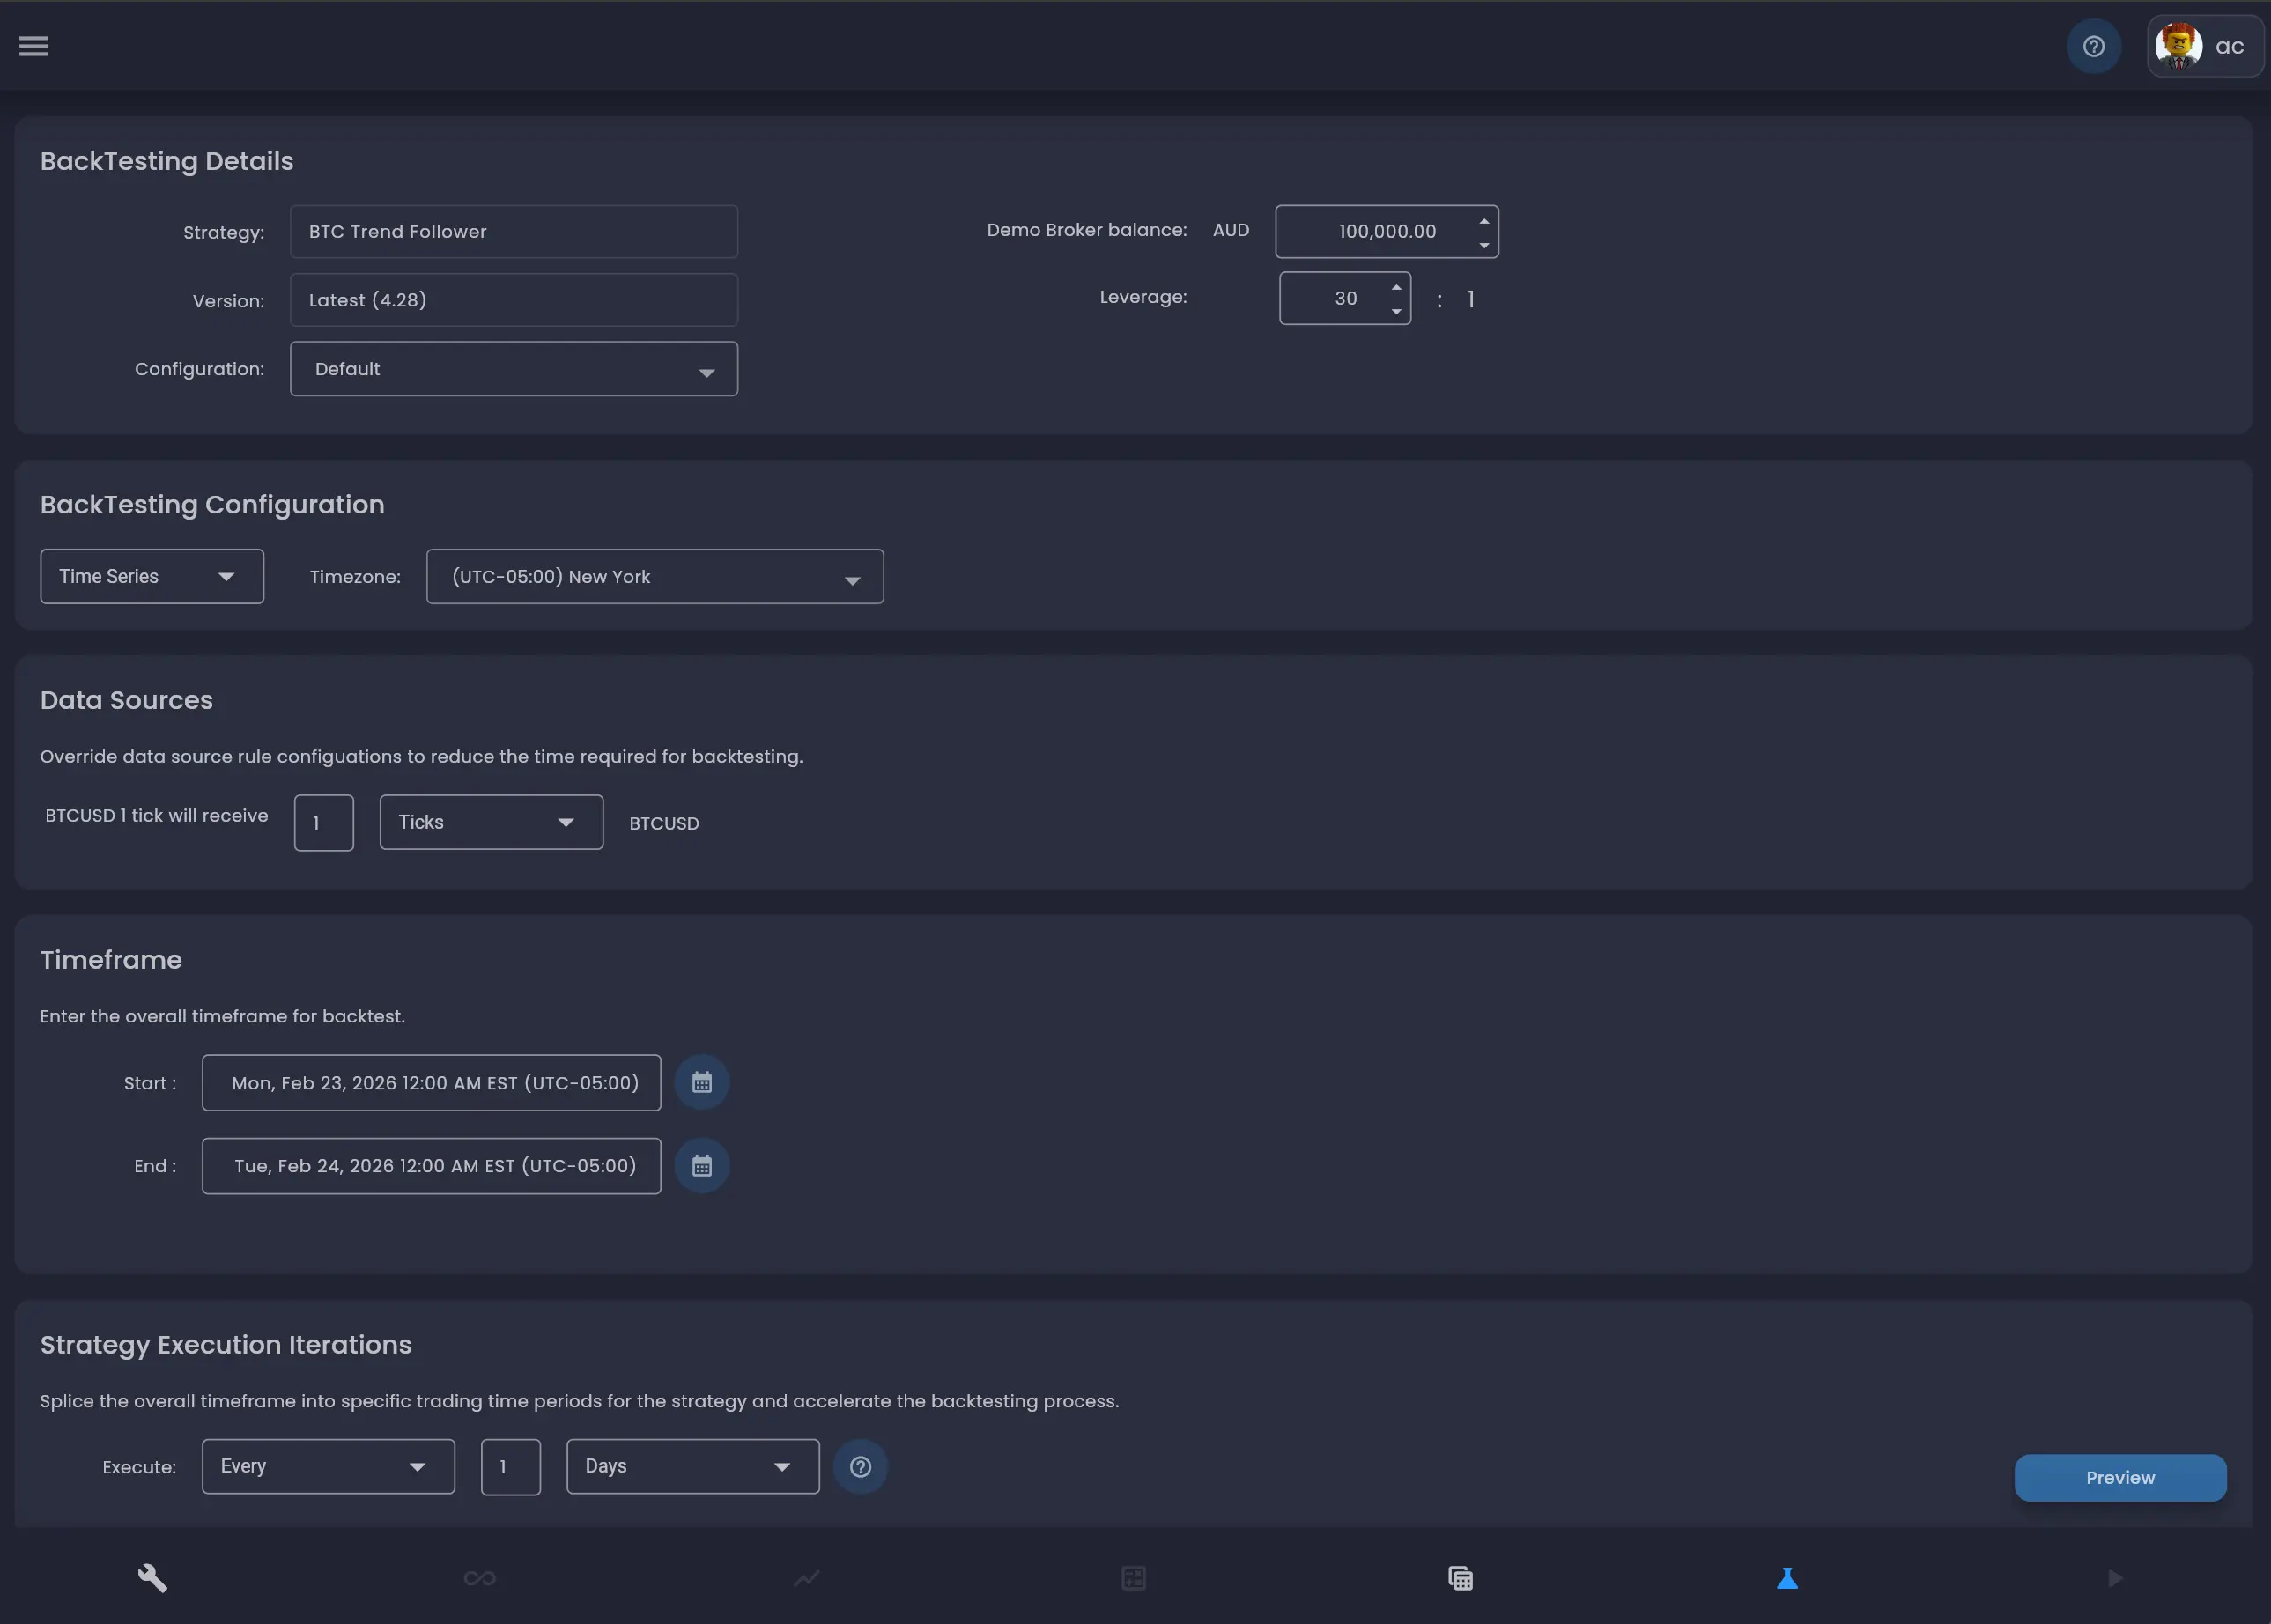
Step 3: Configure BackTesting Data
The BackTesting Configuration Data section determines whether to use custom time series data or data from a previously deployed stratetgy for the simulation engine.
- Data Configuration — Select
Time Series. This mode allows you to explicitly define the time period for the backtest data that will be used in the backtest. - Timezone — Select the timezone you want the backtest to use for date and time
calculations. This affects how daily candles are aligned and when scheduled events fire. In this example,
select
(UTC-05:00) New York
Choose Time Series mode for backtesting during development. The Strategy option is designed
to support analysis of the results of a deployed Strategy.
Step 4: Configure the Time Series
The Time Series Configuration section defines the overall historical period over which the strategy will be simulated. Click the calendar icons to set the start and end dates:
- Start — Set the start date and time for your in sample backtesting timeframe.
1 Jan 2025provides data for each of the data sources starting from this date. - End — Set the end date and time for your in sample backtesting timeframe. For example,
1 Feb 2025provides a month of data for the simulation.
When choosing a timeframe to backtest, choose time-periods to use as target in-sample market conditions to optimise your strategy (trending markets, ranging markets or volatile periods). You should then use out-of-sample time periods to validate your strategy is robust. Start with a shorter period to verify the strategy logic works as expected, then extend the timeframe for a more thorough evaluation.
Step 6: Configure Strategy Execution Iterations
The Strategy Execution Iterations section controls how the overall timeframe is split into individual trading periods. Each iteration deploys a fresh instance of the strategy for that time window.
- Execute — Set to
Every. - Frequency — Set to
1. - Period — Set to
Days.
With these settings, the backtest will deploy your strategy once per day across the entire timeframe. Each day becomes one iteration in the results. This is useful for evaluating how the strategy performs on different days.
When choosing to run a single iteration, the Analyse Mode dropdown will be shown. This
allows you to select the level of analysis data captured during the backtest. By default a backtest iteration
is run in
Final State mode, which is the fastest option and provides the state of the strategy and the
rules at the end of the backtest.
For detailed analysis, select Full Analysis. This will provide analysis of the state of the
strategy at every event in the backtest and is very powerful debugger for identifying the root cause of issues
with strategy
logic.
Iteration settings are a great way to achieve a number of different goals when assessing performance, optimising strategy logic or debugging. For example, a strategy that opens and closes trades within a single day works well with daily iterations. A strategy that holds positions for days or weeks would need longer iteration periods or a single iteration spanning the full timeframe. See Strategy Execution Iterations for guidance on choosing the right iteration settings.
Click the Preview button to see a summary of the iterations before starting the backtest. This shows you exactly how many iterations will be created and their date and time ranges, so you can verify the configuration is correct.
Step 7: Run the Backtest
With all parameters configured, click the Preview button to review the iteration schedule, then confirm to start the backtest. The platform will begin processing each iteration through the historical data.
You can navigate to other parts of the platform while the backtest runs. The BackTests in Progress section at the top of the BackTest Results page shows any currently running backtests. When a backtest completes, it moves to the BackTest Results list below.
Step 8: View the Results List
Navigate to the BackTest Results page to see all completed backtests. The results list shows a table with the following columns for each backtest:
- Created — When the backtest was created.
- Start / End — The timeframe that was tested.
- Name — The strategy name.
- Version — The strategy version that was tested.
- Configuration — The backtest configuration used.
- Iterations — How many iterations were run.
- Gross — The total gross profit or loss across all iterations, shown in green for profit and red for loss.
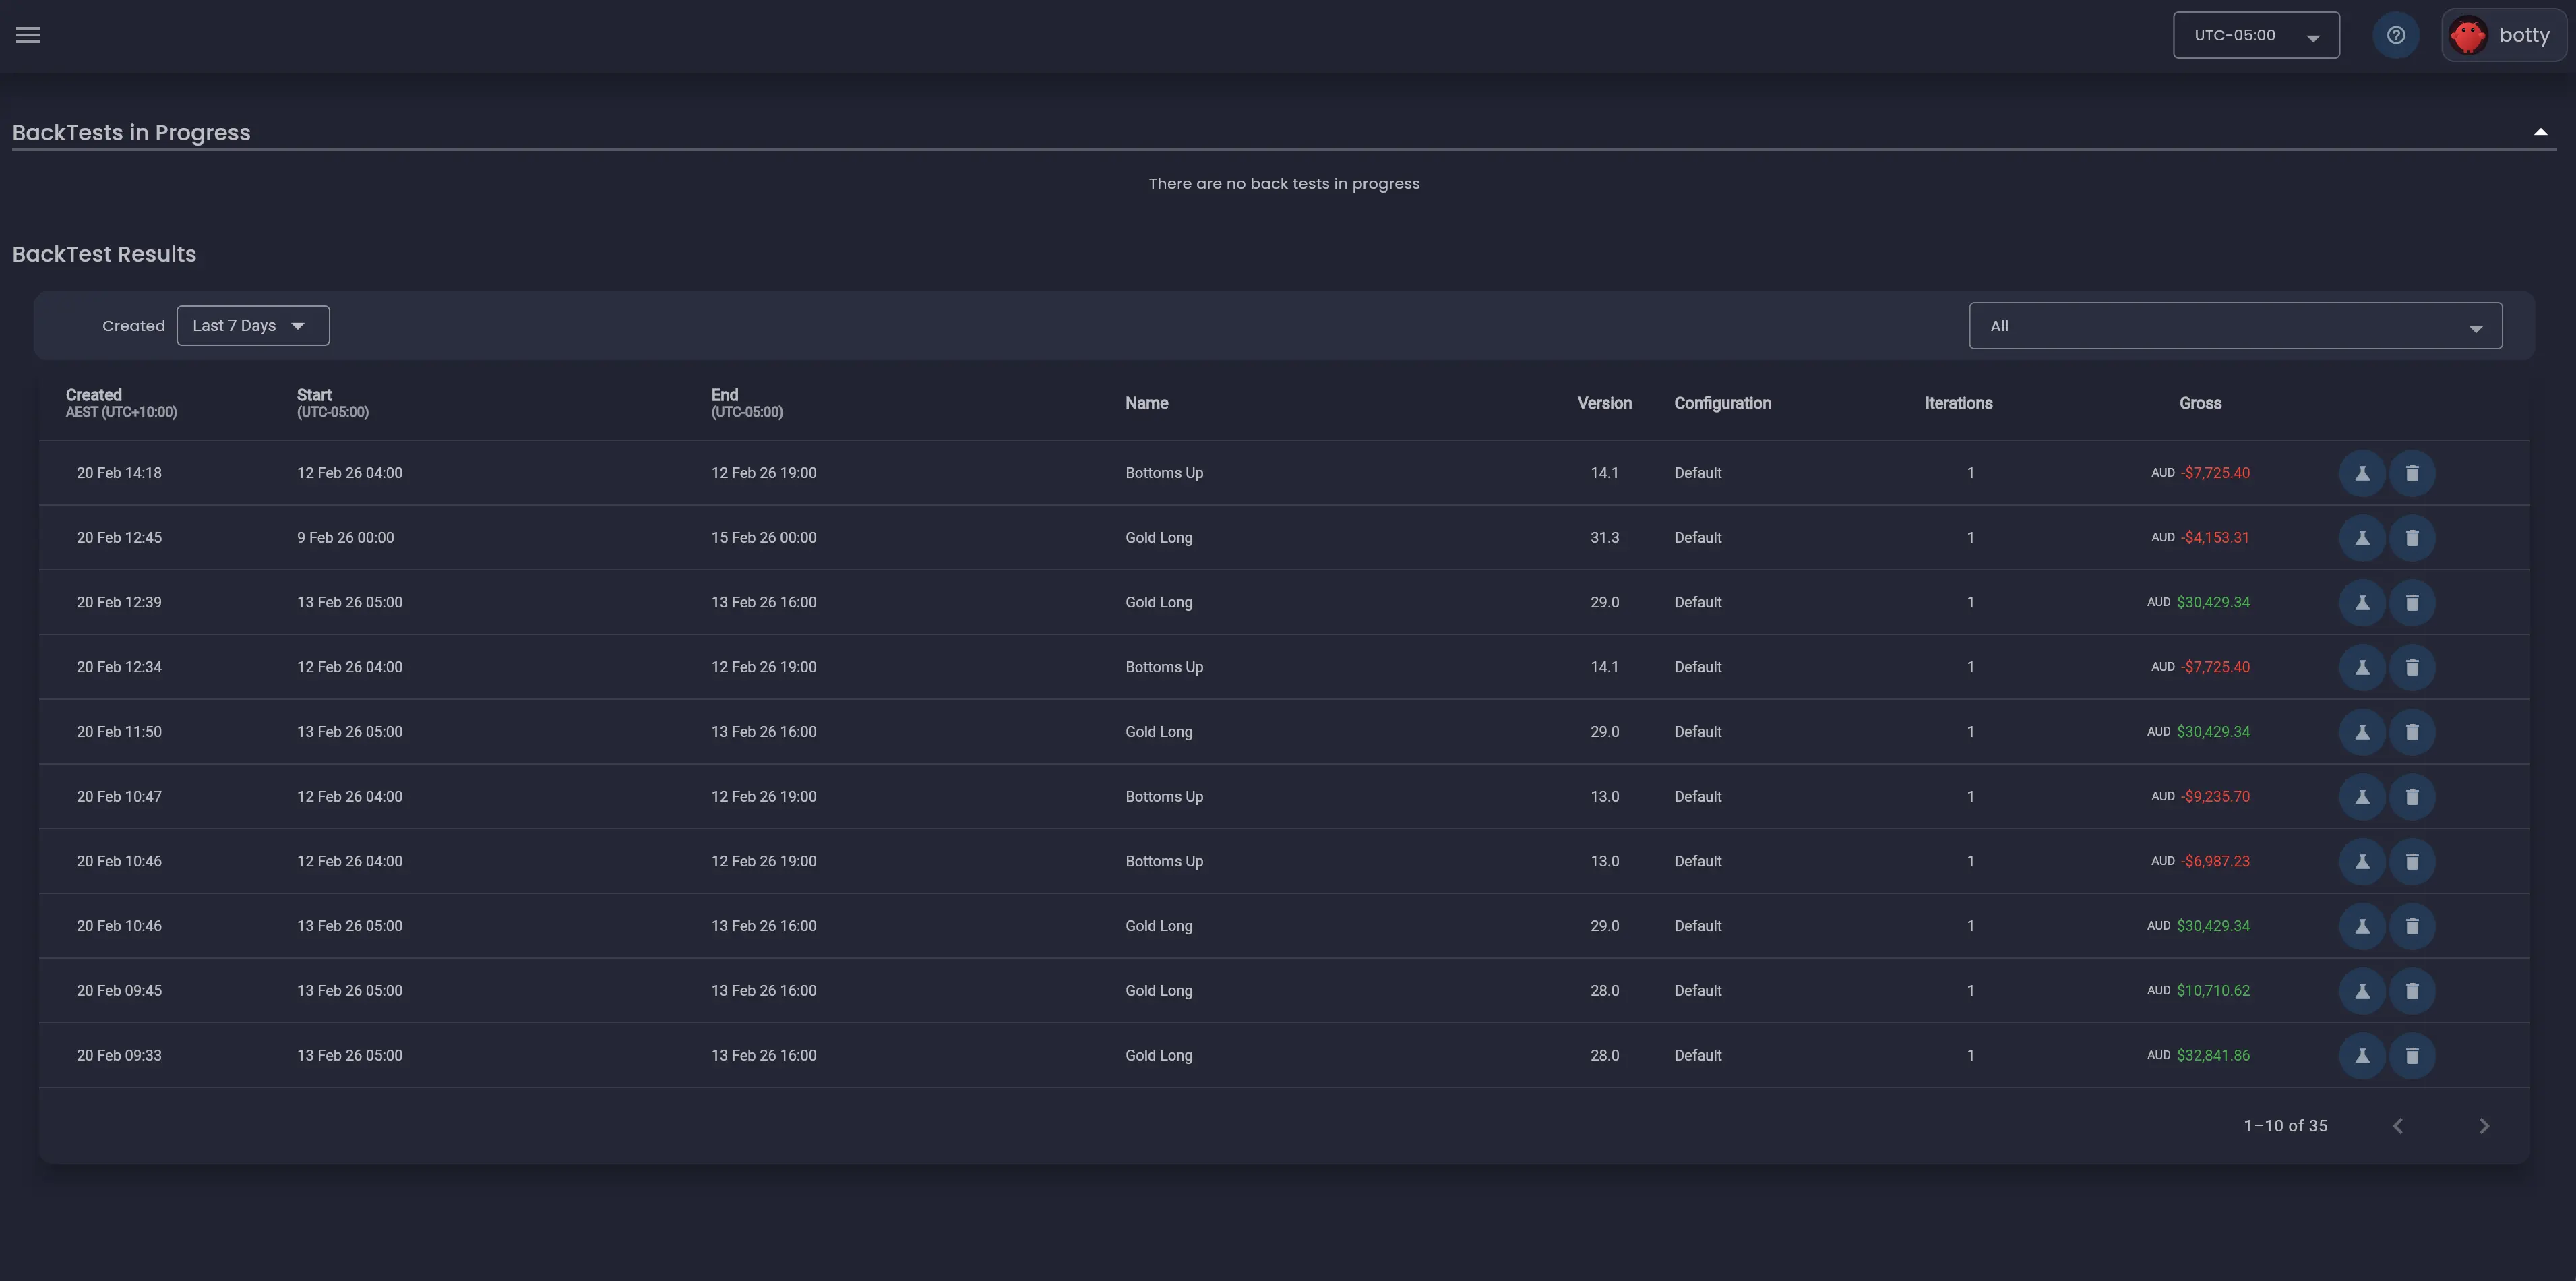
Click on any row to open the detailed results for that backtest. You can also use the date filter and strategy filter dropdowns to find specific results.
Step 9: Explore the Results Dashboard
Clicking into a backtest result opens the detailed results dashboard. This is where you evaluate your strategy's historical performance.
Results Overview
The left panel shows key information about the backtest including the strategy name, configuration, version, start and end dates, currency and when it was created.
Iterations Table
The main area shows a table of all iterations. Each row represents one execution of the strategy within its time window. The table includes:
- # — The iteration number.
- Start / End — The time window for this iteration.
- Duration — How long the iteration ran.
- End State — Whether the iteration completed successfully.
- Max DD — The maximum drawdown during this iteration.
- Max Profit / Max Loss — The highest profit and deepest loss reached.
- Gross — The final profit or loss for this iteration.
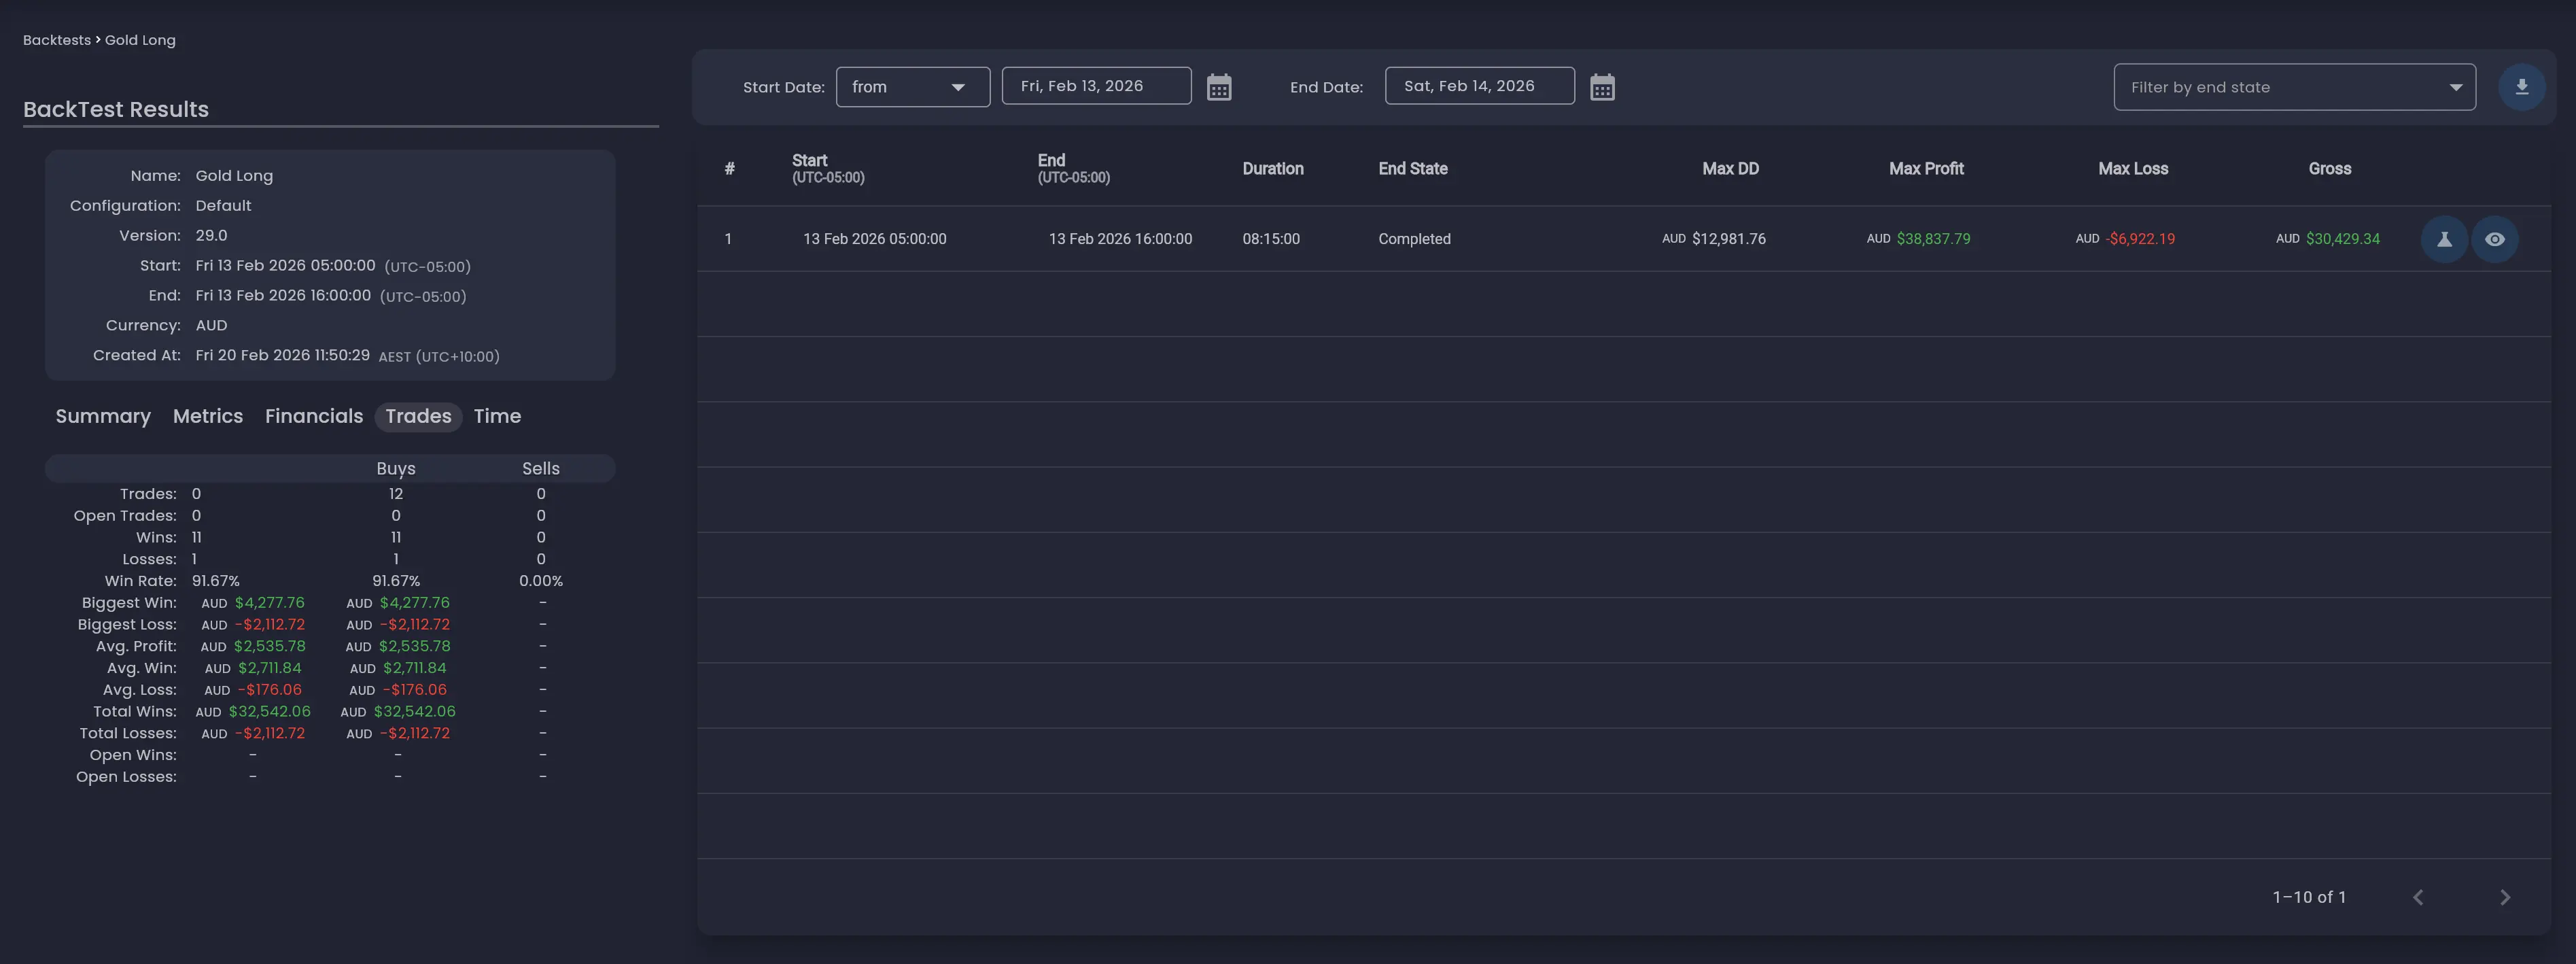
Results Tabs
Below the overview panel, a set of tabs provides different views of the aggregated results:
- Summary — A high-level overview of the backtest performance.
- Metrics — Detailed performance metrics across all iterations.
- Financials — Financial breakdown including fees, commissions and net results.
- Trades — Aggregated trade statistics including total trades, win rate, biggest win/loss, average profit and more. This tab breaks down results by Buys and Sells.
- Time — Time-based analysis of the results.
Trade Analysis
To examine individual iterations in detail, click the view icon on any iteration row. This opens the Trade Analysis view, which provides a powerful set of tools for understanding exactly what happened during that iteration.
The Trade Analysis view includes:
- Strategy State dialog — Shows the key metrics of the strategy at any point in time, including equity, profit, max drawdown, number of trades.
- Account Balance chart — An equity curve showing how the account balance changed over the iteration period.
- Timeline — After running a backtest configured with
Full Analysis, a slider at the top of the screen lets you step through time and see the state of the strategy at any moment. - Strategy Analysis View — Your strategy designer canvas now displays which rules fired and how many times at any point in your stratgey. Clicking on a rule will show an option to view the state of the rule at the selected point in time through the Rule State Dialog.
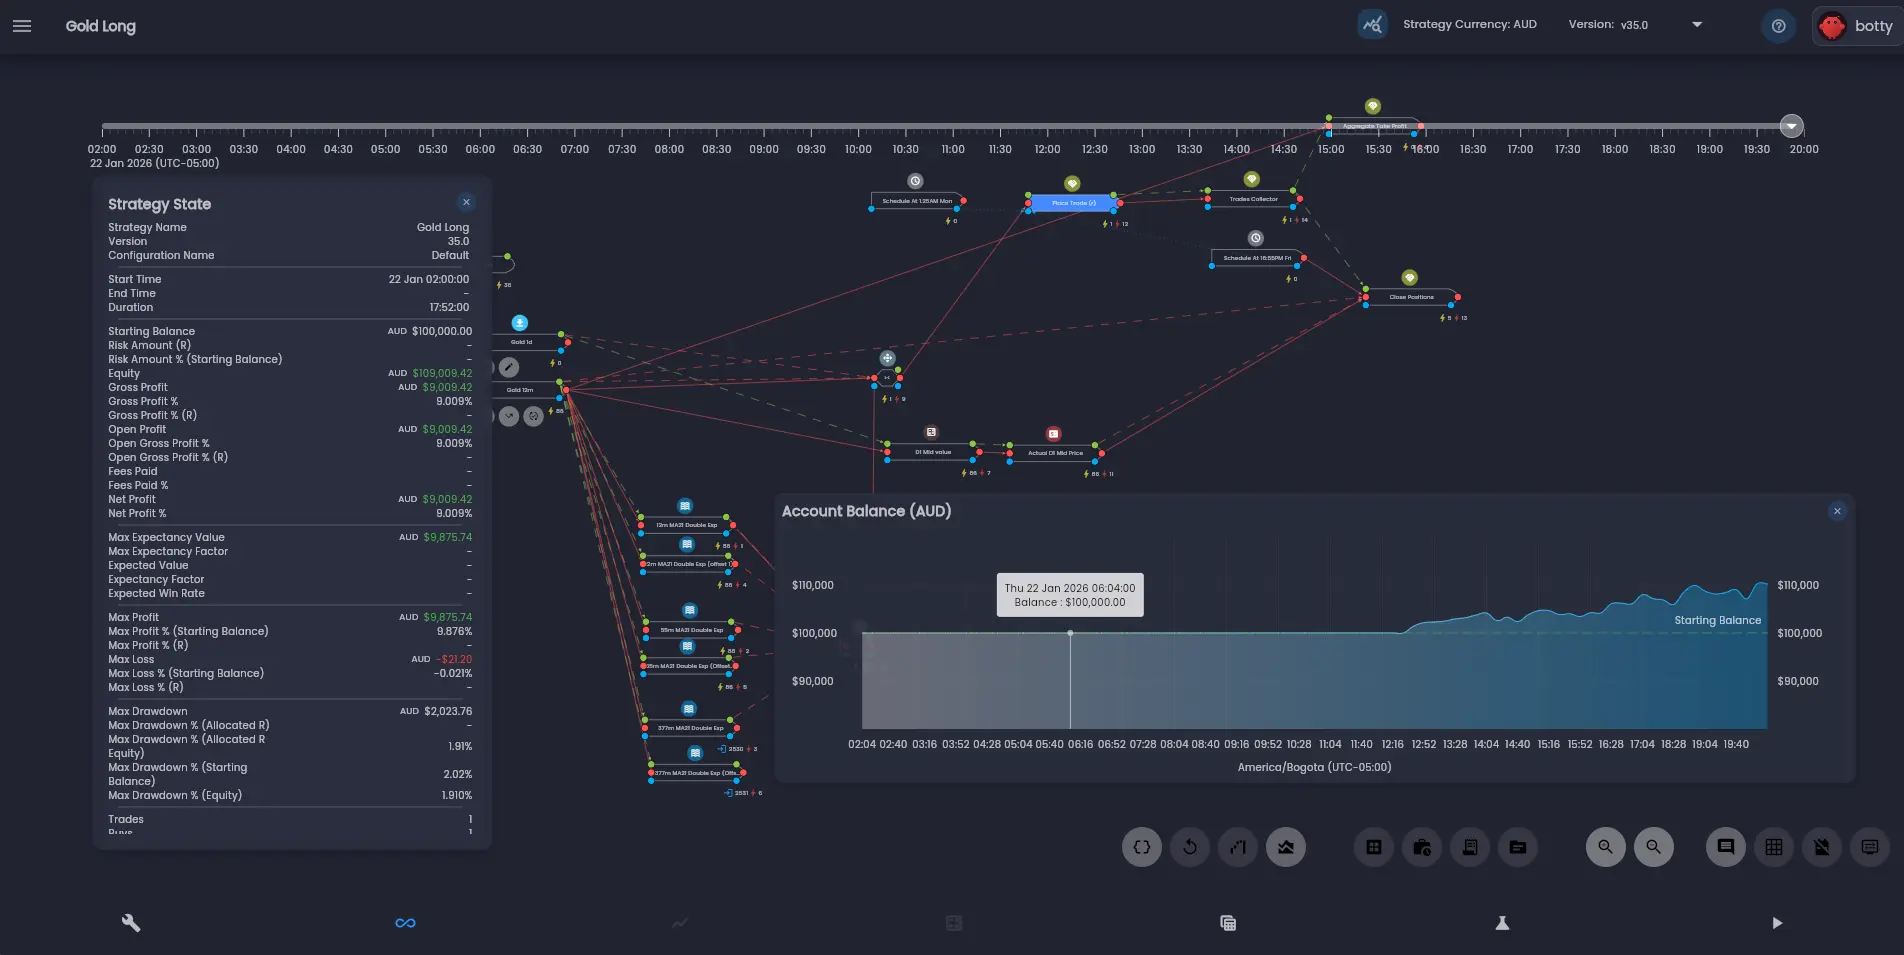
For a deeper dive into the Trade Analysis tools, see The Analysis Screen and Timeline and Playback.
Understanding Key Metrics
To make informed decisions about your strategy, you need to understand what each metric tells you. Here are the most important ones from the results dashboard:
Gross Profit and Net Profit
Gross profit is the total profit or loss before fees and commissions are deducted. Net profit subtracts all trading costs (fees, commissions, swap charges) to show the actual bottom line. The Gross Profit % and Net Profit % metrics express these as a percentage of your starting balance. These are the most straightforward measures of profitability, but should never be evaluated in isolation.
Win Rate
Win rate is the percentage of trades that were profitable. The results dashboard shows this for Buys and Sells separately. A high win rate is not always better — some of the most successful strategies have win rates below 50% but make significantly more on their winning trades than they lose on their losing ones. What matters is the relationship between win rate and the average win-to-loss ratio (Average Win vs Average Loss).
Profit Factor
Profit factor is the ratio of total wins to total losses. A profit factor above 1.0 means the strategy is profitable overall. A profit factor of 2.0 means you earned twice as much on winning trades as you lost on losing trades. Generally, a profit factor above 1.5 is considered good for a systematic strategy.
Maximum Drawdown
Maximum drawdown measures the largest peak-to-trough decline in your equity, expressed as both a dollar amount and a percentage. The results dashboard shows several drawdown variants:
- Max Drawdown — The absolute dollar amount of the largest decline.
- Max Drawdown % (Starting Balance) — The drawdown as a percentage of the starting account balance.
- Max Drawdown % (Equity) — The drawdown as a percentage of the peak equity at the time.
This is a critical risk metric — it tells you the worst-case loss you would have experienced. A strategy with a 20% max drawdown means your account could have dropped by 20% before recovering.
Expectancy
Expectancy measures the average amount you can expect to gain or lose per trade. It combines win rate with average win and loss sizes to give a single number representing the edge your strategy provides. A positive expectancy means the strategy is expected to be profitable over a large number of trades. The Max Expectancy Value shows the highest expectancy achieved during the backtest period.
No single metric tells the whole story. Always look at multiple metrics together. A strategy with a high return but an extreme maximum drawdown may not be suitable for your risk tolerance, even if the final profit number looks attractive.
What to Do Next
After reviewing your first backtest results, you have several paths forward:
Iterate on Your Strategy
If the results are not satisfactory, go back to the Strategy Designer and adjust your parameters. Try different moving average periods, add a filter rule to avoid trading in choppy markets, or adjust your stop loss percentage. Then run another backtest to see how the changes affect performance. This iterative cycle of adjusting and testing is the core of strategy development.
Explore Trade Analysis
Use the analysis screen to inspect the state of the strategy after execution. When using a higher fidelity analysis mode, you can step through the timeline and understand exactly why the strategy entered and exited at each point. This is the best way to build intuition about how your rules interact with real market conditions.
Try Different Instruments
Test your strategy on different instruments to see if the logic generalises. A strategy that only works on one stock may be overfit to that particular price history. Robust strategies tend to perform reasonably well across multiple instruments.
Learn More About the Strategy Designer
Now that you have the basics down, explore the deeper features of the platform. The Strategy Designer Overview covers advanced canvas features, and the Rules Library documentation details every available rule and its parameters.
Avoid overfitting: Resist the temptation to keep tweaking parameters until the backtest looks perfect. A strategy that is too closely tailored to historical data is unlikely to perform well in live markets. Focus on simple, logical rules that you believe capture a genuine market behaviour, and validate them across multiple time periods and instruments. See Strategy Execution Iterations for best practices.
Congratulations
You have successfully completed the Getting Started guide. You now know how to create an account, navigate the platform, build a strategy using the visual canvas, and run and interpret a backtest. These are the fundamental skills you will use every day on Arconomy.
From here, dive deeper into the documentation to unlock the platform's full capabilities. The Strategy Designer section covers advanced canvas features, multi-symbol strategies, and dynamic risk management. The Backtesting section explores tick-level simulation, configurable parameters, and techniques for interpreting results. And the Broker Connections section will guide you through deploying your strategies for live trading when you are ready.
Was this helpful? Let us know