Strategy Designer Overview
The Strategy Designer is the central workspace in Arconomy where you visually build trading strategies. Instead of writing code, you place rules onto a canvas, configure their parameters, and connect them together to define how your strategy executes.
Interface Layout
The Strategy Designer is made up of three main areas:
- Rules Menu (left panel) — contains rule categories you can drag onto the canvas. There is also a search box to quickly find rules by name, and an Add Note button for adding notes directly to the canvas.
- Canvas (centre) — the visual workspace where you arrange and connect rules.
- Toolbar (bottom-right) — canvas controls for zoom, undo/redo, save, layout and more.
The top bar displays the strategy name, strategy currency, version number and last saved timestamp. The hamburger menu in the top-left opens the main navigation, and the help icon provides quick access to documentation.
Rules Menu
The left panel is the rules menu where you find and add rules to the canvas. Rules are organised into categories, each with a coloured icon:
- Controls — flow control rules such as Logic, Logic Count, If Else, Reset, End Strategy and Stop Strategy.
- Trade — rules for placing trades, setting stop losses, take profits and managing positions.
- State — rules that read or monitor account, strategy and trade state.
- Data — rules for fetching market data such as Price Data and Volume Data.
- Time — time-based rules including schedulers and date/time filters.
- Price — price-level rules such as highest price, lowest price and price retracement.
- Math — mathematical operations including calculators, comparisons and converters.
- Indicators — technical indicators such as Moving Average, RSI, MACD, Bollinger Bands and more.
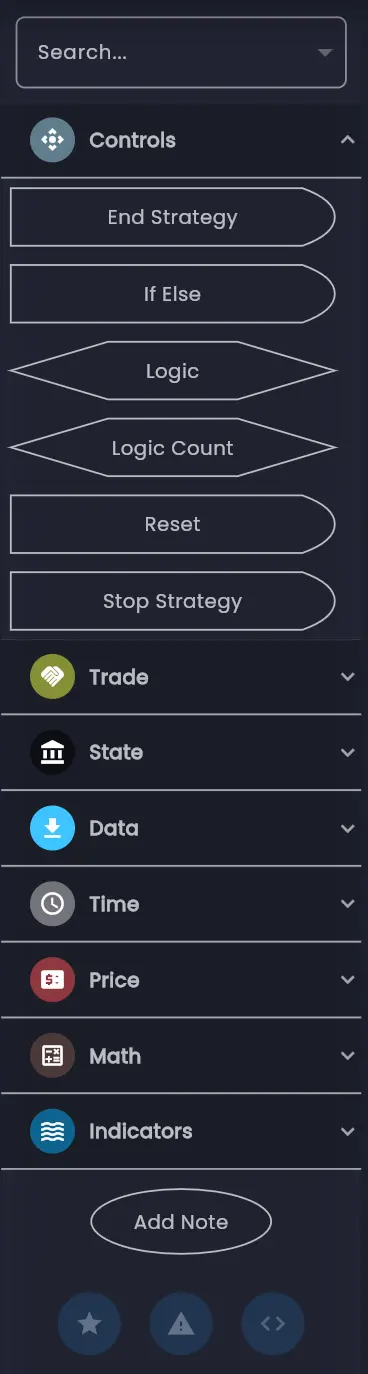
Click a category to expand it and reveal the available rules. Each rule is displayed as a shape that matches how it will appear on the canvas — for example, Logic rules appear as diamond shapes while most other rules appear as rectangles. You can also use the Search box at the top to find rules by name.
To add a rule to the canvas, click and drag it from the rules menu onto the canvas, or simply click it to place it at a default position.
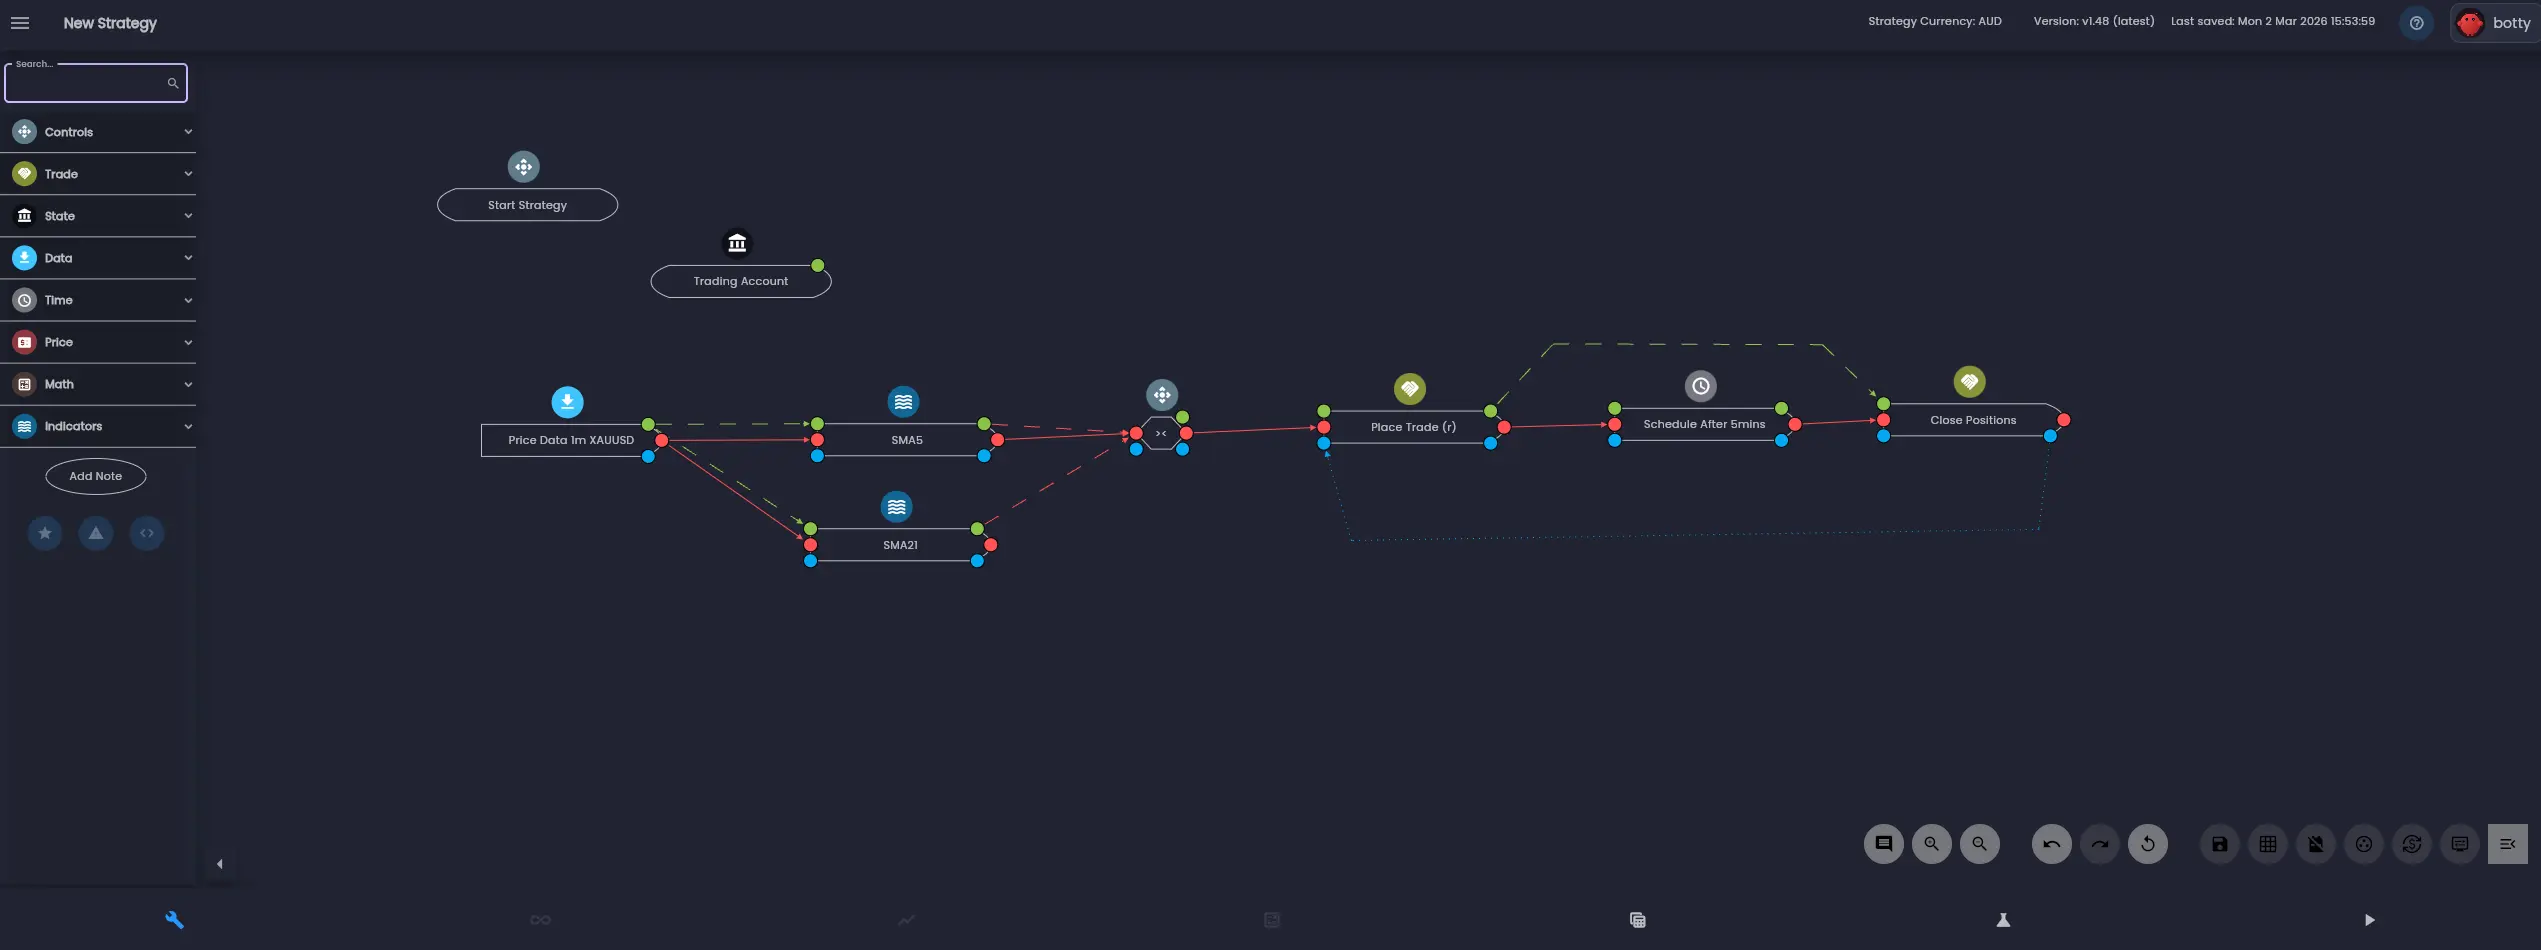
The Canvas
The canvas is a free-form, zoomable workspace where your strategy takes shape. Each rule on the canvas appears as a node — displaying the rule name, a coloured icon indicating its category, and input/output ports along its edges.
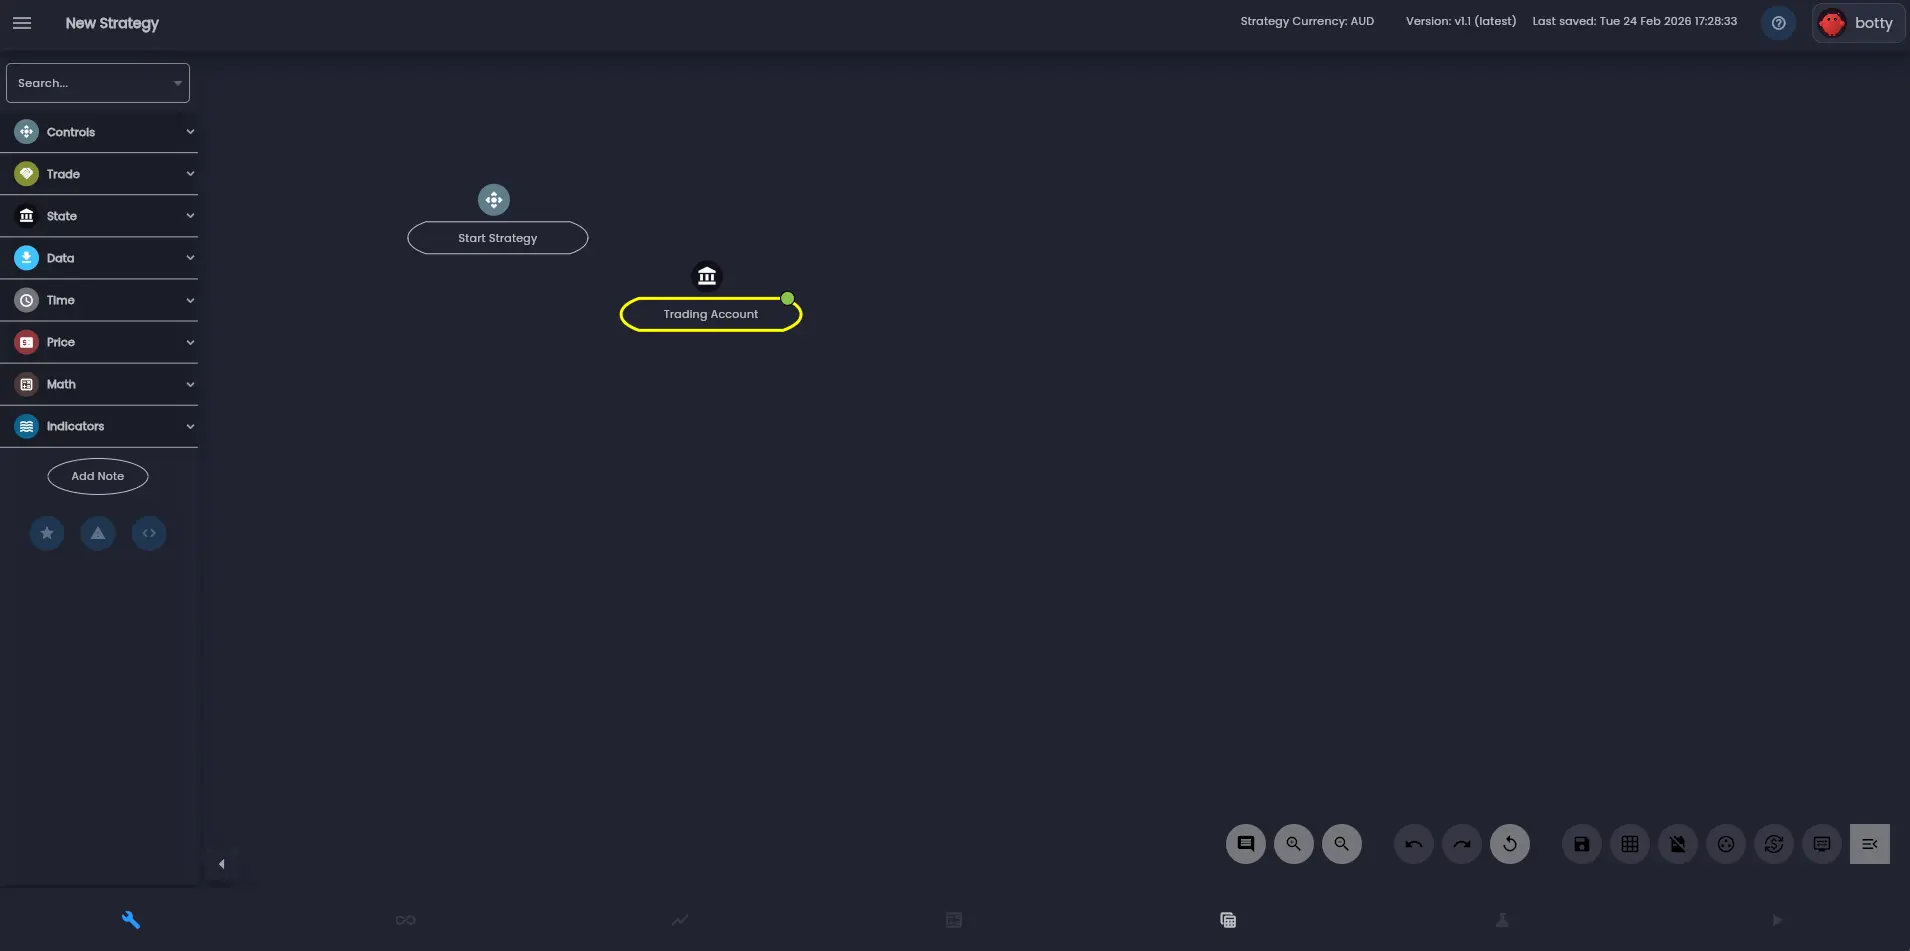
When you create a new strategy, two rules are added to the canvas by default:
- Start Strategy — the entry point that controls when the strategy begins executing. You can configure it to start immediately or on a schedule.
- Trading Account — defines which broker account the strategy trades on and sets overall risk boundaries.
Every strategy requires both of these rules. From here you add more rules and connect them together to build your trading logic.
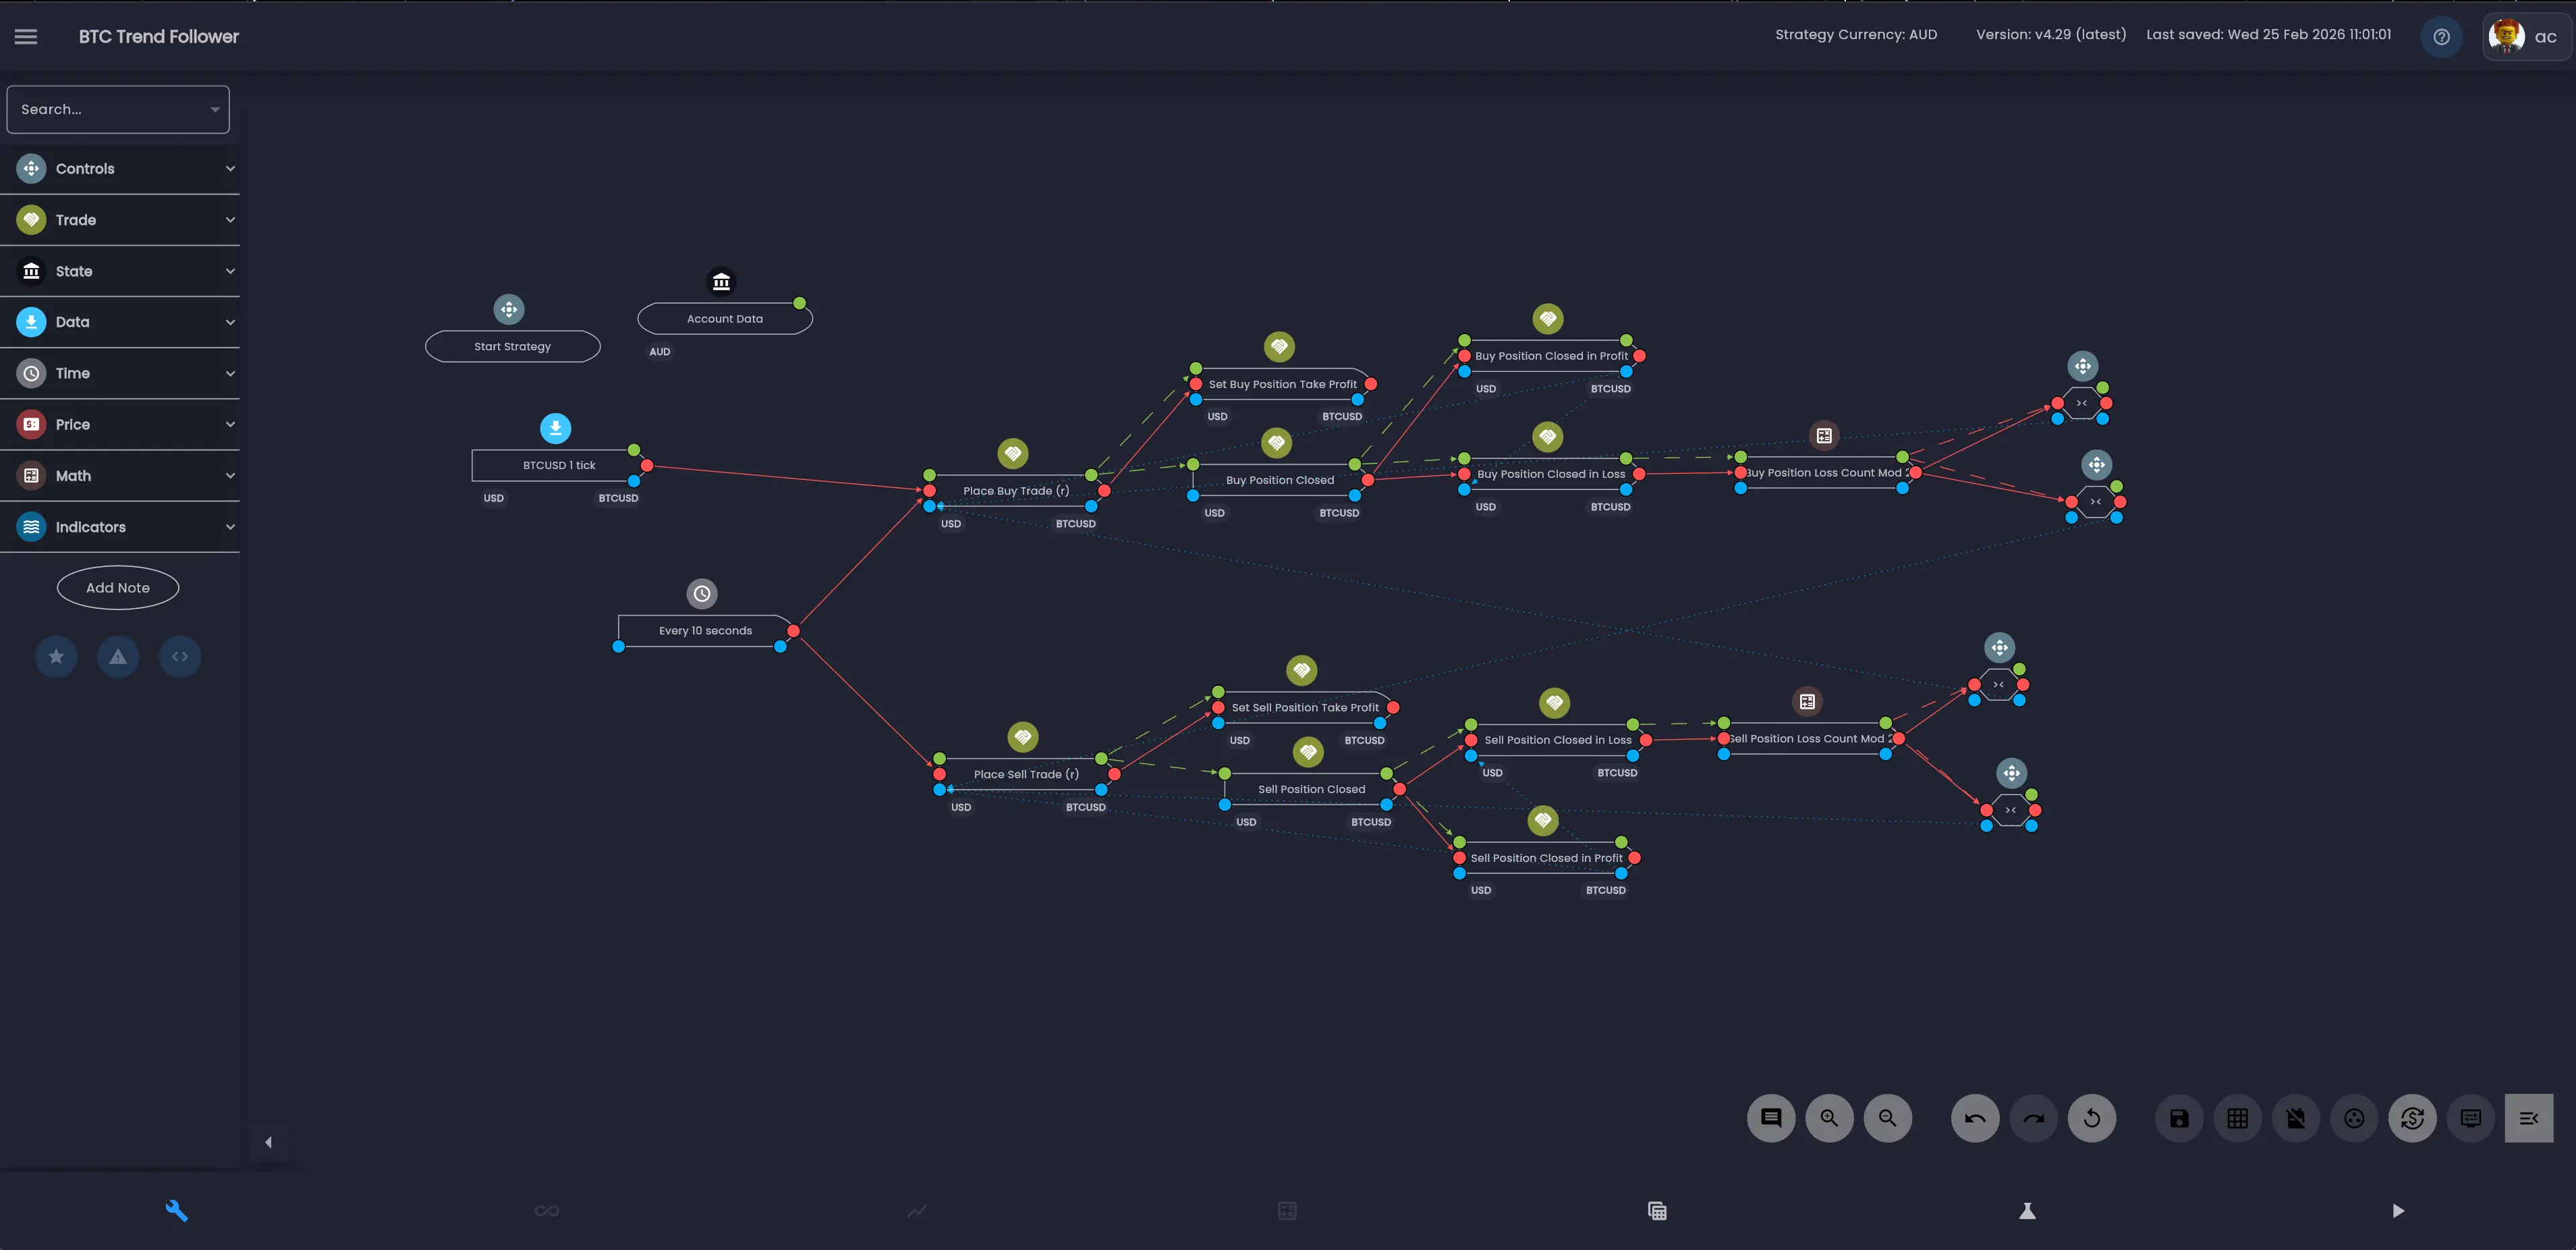
Nodes and Connections
Rules on the canvas have coloured ports along their edges. These ports are how you create connections between rules. There are three types of connections, each shown as a different coloured line:
- Execution Dependencies (red solid lines) — define when a rule executes relative to another rule. For example, "execute After SMA20" means the rule runs after SMA20 completes.
- Data Dependencies (green dashed lines) — pass data from one rule's output into another rule's input. For example, connecting Price Data output into a Moving Average input.
- Enable, Disable and Reset (blue dotted lines) — control whether other rules are active. A rule can enable, disable or reset other rules after it executes.
To create a connection, click on an output port to highlight it and then click on the corresponding input port on another rule. The port colours indicate which type of connection will be created. Each connection type is covered in detail in its own documentation page: Execution Dependencies, Data Dependencies, and Enable, Disable and Reset.
Tip: You can click and drag a connection line to create joints and make a connection line more visible directing the flow around other nodes. To remove a joint, click and hold the highlighed joint.
Working with Rules on the Canvas
Click a rule on the canvas to select it. When selected, a set of action buttons appears around the node:
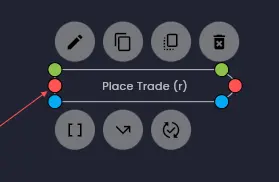
The top row of buttons provides:
- Edit (pen icon) — opens the Edit Rule dialog where you configure the rule's parameters, execution dependencies, input/output data and style.
- Clone — creates a copy of the rule with the same configuration that can be editted.
- Shadow — creates a shadow copy of the rule that shares configuration with the original and cannot be editted.
- Delete — removes the rule and all its connections from the canvas.
The bottom row provides:
- Show/Hide Data Dependencies — shows or hides the rule's data dependencies links.
- Show/Hide Execution Dependencies — shows or hides the rule's execution dependencies links.
- Show/Hide Enable, Disable and Reset — shows or hides the rule's enable, disable and reset dependencies links.
You can move rules by clicking and dragging them to a new position. The visual position of rules on the canvas does not affect execution order — execution order is determined entirely by how rules are connected. However, keeping your canvas tidy helps with readability.
The Edit Rule Dialog
When you click the edit button on a selected rule, the Edit Rule dialog opens. Every rule has a Name field and a Description field at the top, followed by configuration tabs.
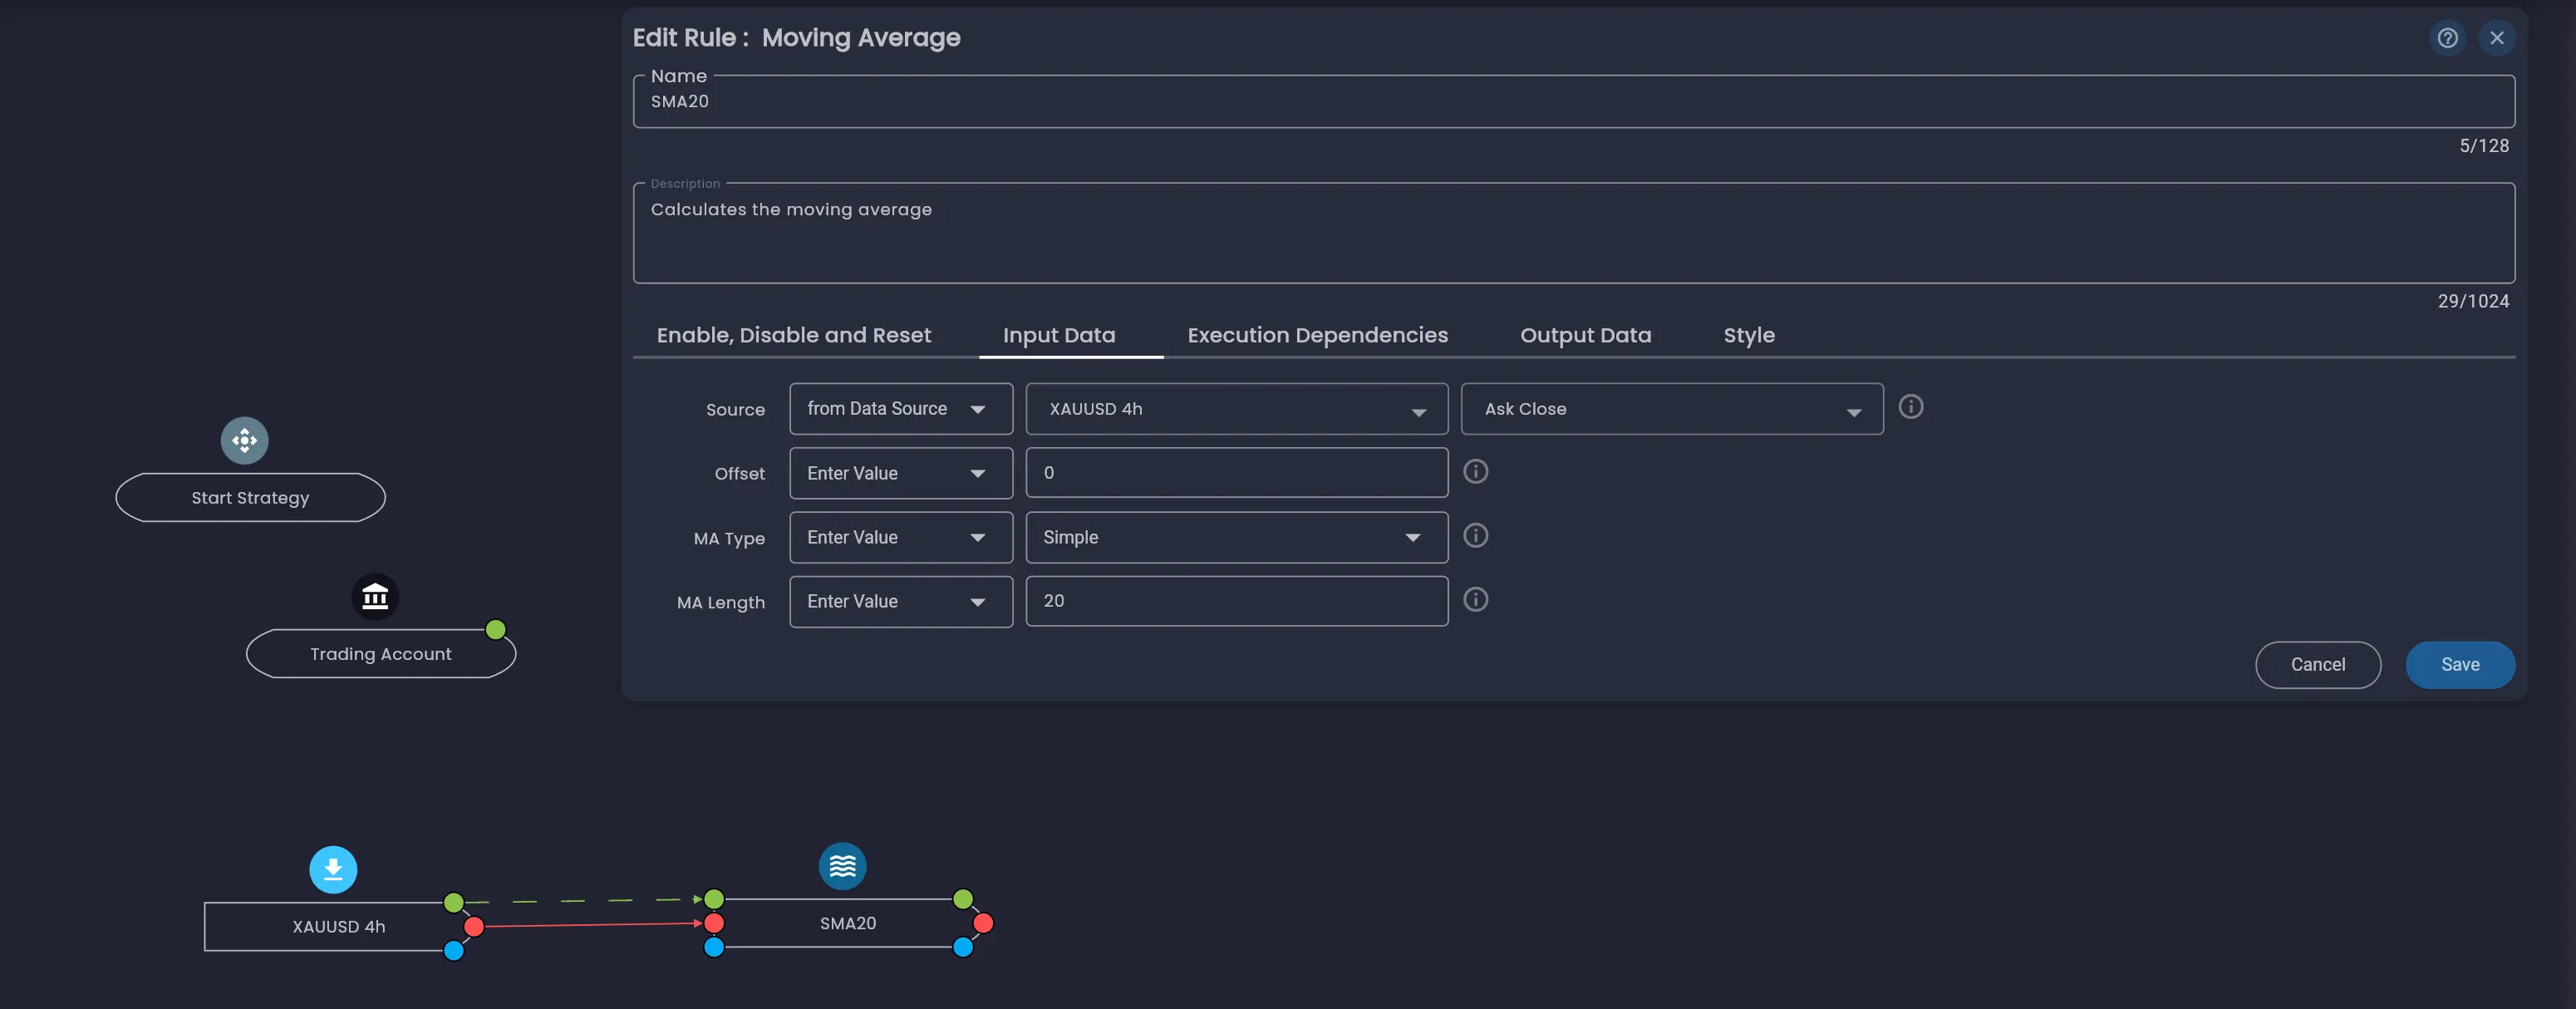
The available tabs vary by rule type, but typically include:
- Enable, Disable and Reset — configure which rules to enable, disable or reset after this rule executes.
- Input Data — set the rule's parameters and data sources.
- Execution Dependencies — define when this rule executes (After/Every statements and conditions).
- Output Data — view the data this rule produces for other rules to consume.
- Style — customise the rule's appearance on the canvas.
For detailed information about configuring rules, see Rule Configuration.
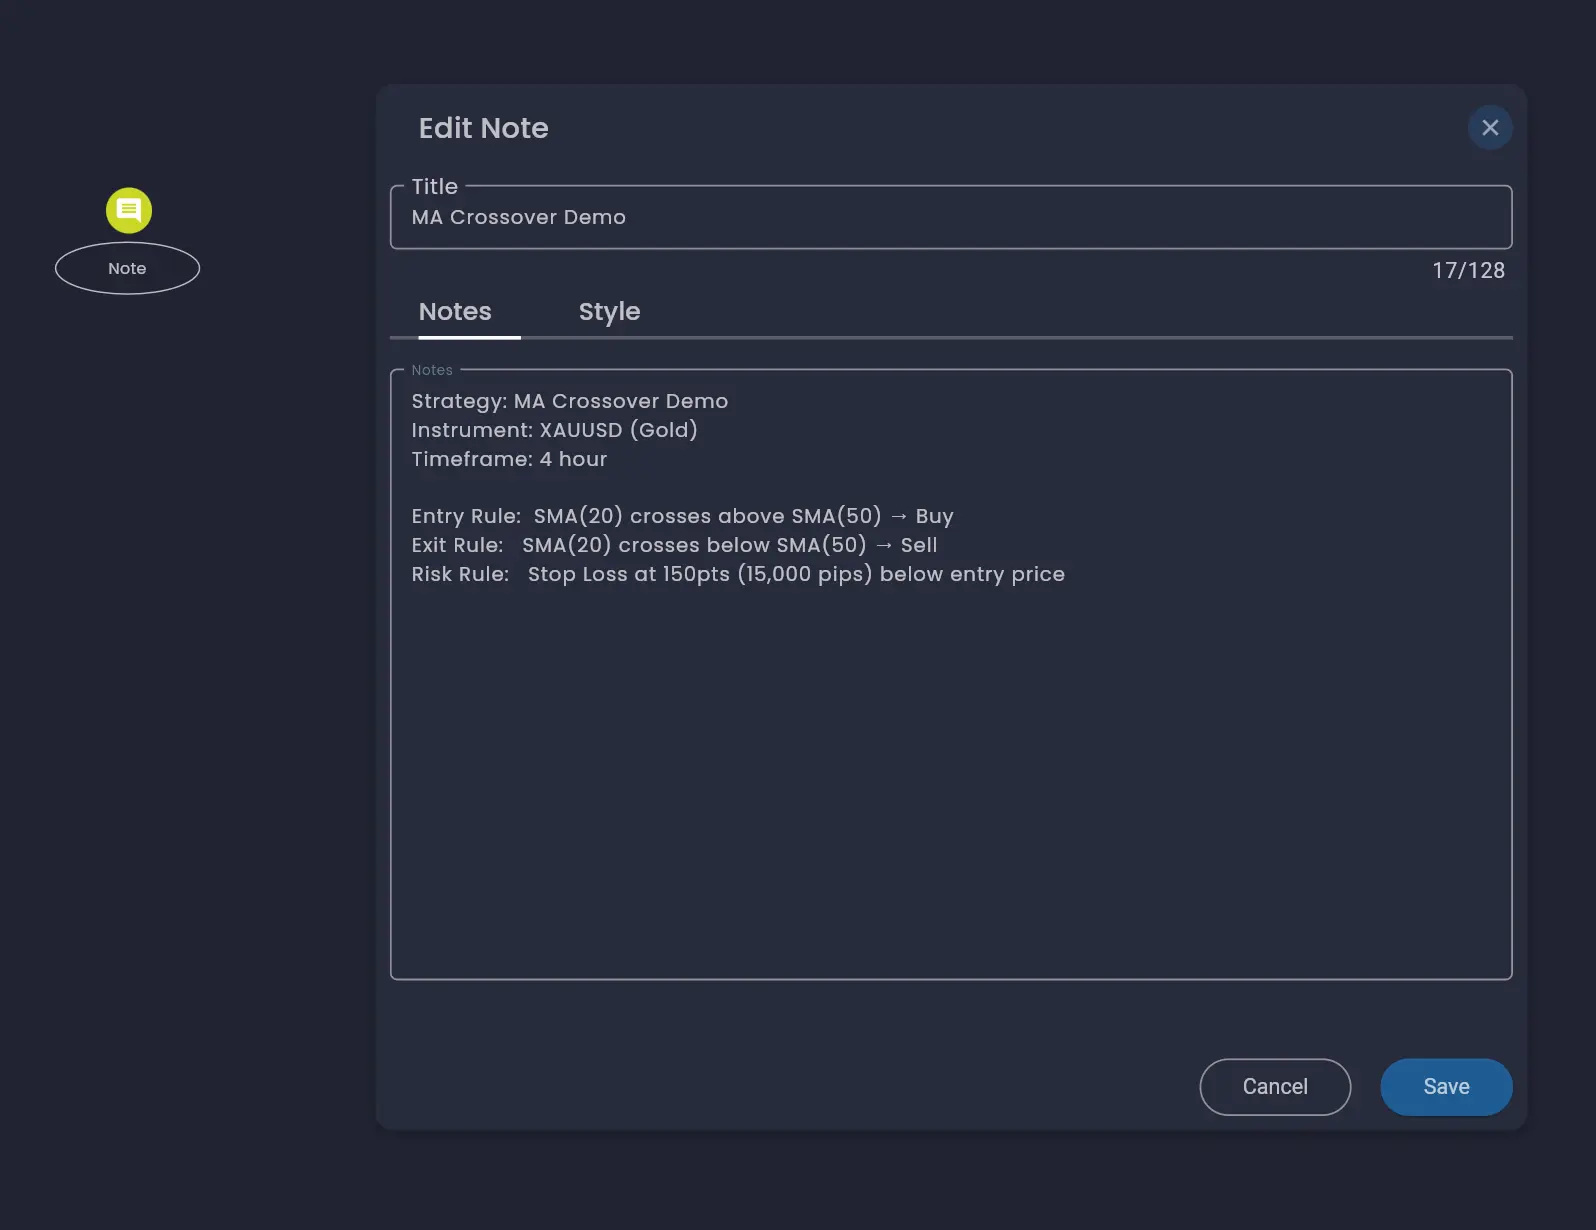
Notes
You can add notes to the canvas to document your strategy logic. Click the Add Note button at the bottom of the rules menu to place a note on the canvas. Notes have a title and a free-text body where you can record your strategy plan, instrument details, or any other information you want to keep alongside your rules.
Canvas Toolbar
The toolbar in the bottom-right corner of the canvas provides quick access to common canvas controls. From left to right, the toolbar includes controls for:

- Enable multi-select — Select multiple rules to move, clone or delete.
- Zoom in / Zoom out — adjust the canvas zoom level. You can also zoom with the mouse wheel or trackpad pinch.
- Reset — reset the canvas to its initial scale.
- Undo / Redo — step backwards and forwards through your editing history.
- Save — save the current state of the strategy.
- Show/Hide grid — show or hide the alignment grid on the canvas.
- Show/Hide Minimap — show or hide the minimap.
- Show/Hide Rule Descriptions — hide or show rule descriptions. By default rule descriptions are displayed when hovering the category icon above a rule.
- Show/Hide Symbols and Currencies — show or hide the symbols and currencies that each rule is configured for. This helps quickly identify rules that may be mis-configured for different symbols and currencies.
- Show/Hide Links — show or hide the data, execution and enable/disable/reset connection links for all rules.
- Show/Hide options — show or hide the options at the bottom of the canvas.
Saving and Versioning
The top bar always displays the current version number and when the strategy was last saved. Each time you save, a new minor version is created. You can go back to a previous minor version while editing the strategy using the undo and redo buttons. When a strategy is deployed or backtested a new major version is created.
Give your strategies descriptive names so you can easily identify them later. For example, "BTC Trend Follower" or "MA Crossover Demo" is more useful than "Strategy 3".
Was this helpful? Let us know