Creating Your First Strategy
In this tutorial you will build a simple moving average crossover strategy from scratch using the Strategy Designer. By the end you will have a fully configured strategy ready to backtest, complete with entry logic, exit logic and a stop loss.
This tutorial assumes you have already created an account and are familiar with the platform layout. If not, review Creating Your Account and Platform Overview first.
What You Will Build
The strategy you will create follows this logic:
- Entry — Buy XAUUSD when the 20-period simple moving average (SMA) is above the 50-period SMA on a 4-hour chart.
- Exit — Close the position when the 20-period SMA falls below the 50-period SMA.
- Risk management — Place a stop loss 15,000 pips ($150) below the entry price to limit downside on each trade.
This is a trend-following strategy that aims to capture sustained price movements by riding the momentum indicated by moving average alignment. Along the way you will learn how the Strategy Designer works, including how to add rules from the rules menu, configure input data, set execution dependencies and connect rules together on the canvas.
Step 1: Create a New Strategy
From the main navigation menu, click Build Strategy. This opens your list of strategies. Click the + Create Strategy button in the top-right corner to open the Create Strategy dialog.
Fill in the following fields:
- Name — Enter
MA Crossover Demo. A clear, descriptive name makes it easy to identify this strategy later as you build more strategies over time. - Description — Optionally add a brief summary of what this strategy does.
- Tags — Optionally add tags to help organise and find your strategies later.
- Currency — Select the currency used to report the strategy’s performance metrics.
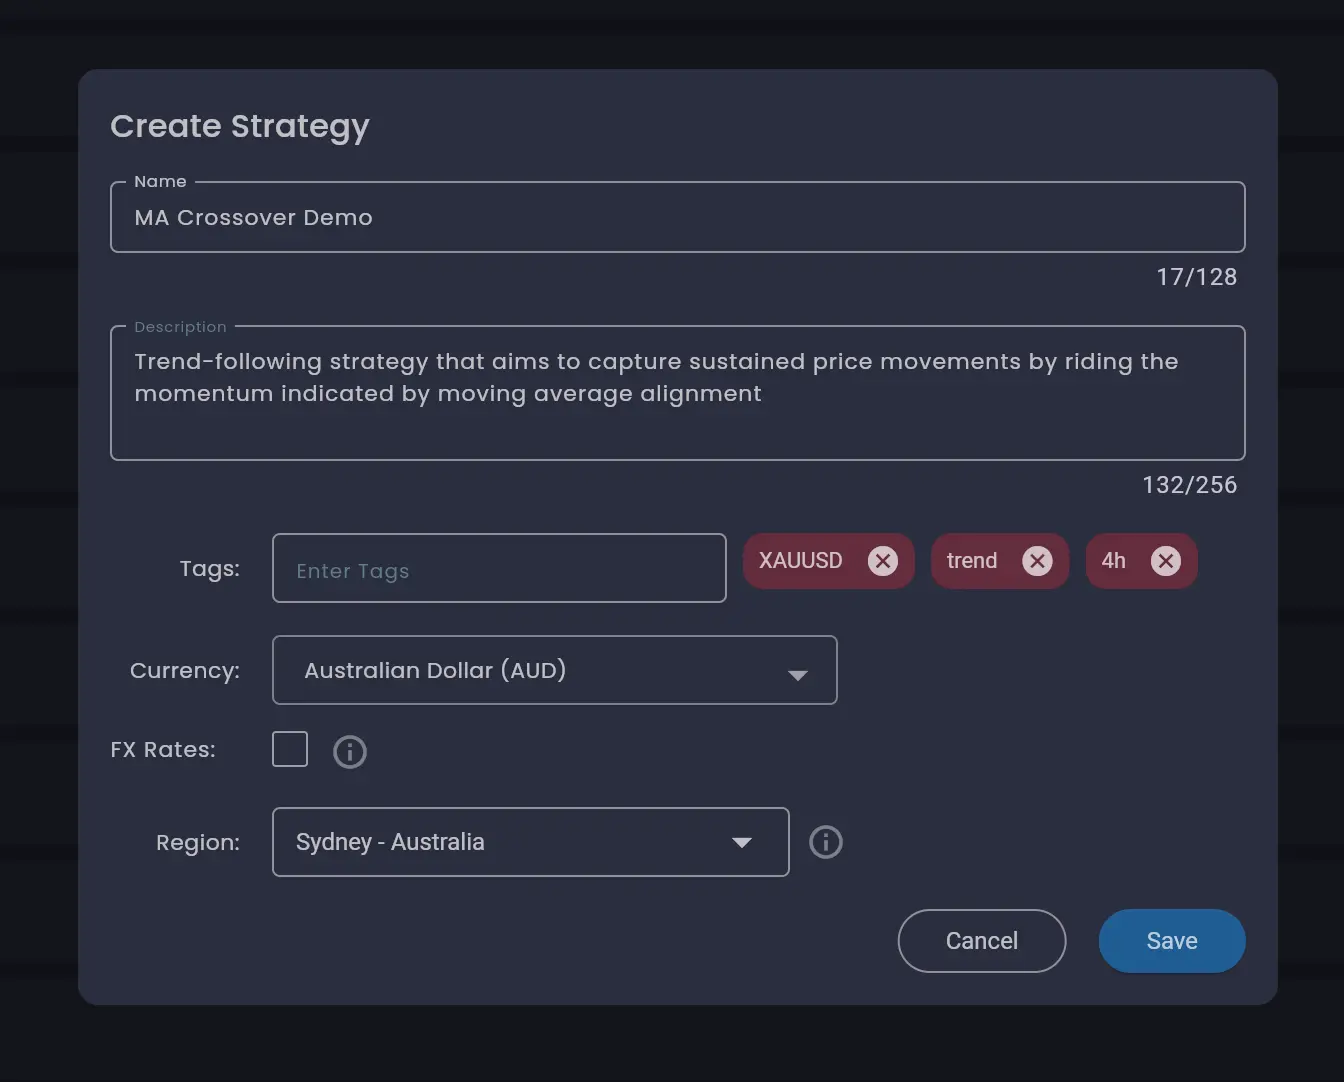
Click Save. You will be taken to the Strategy Designer where you can start building your strategy.
The Strategy Designer has three main areas:
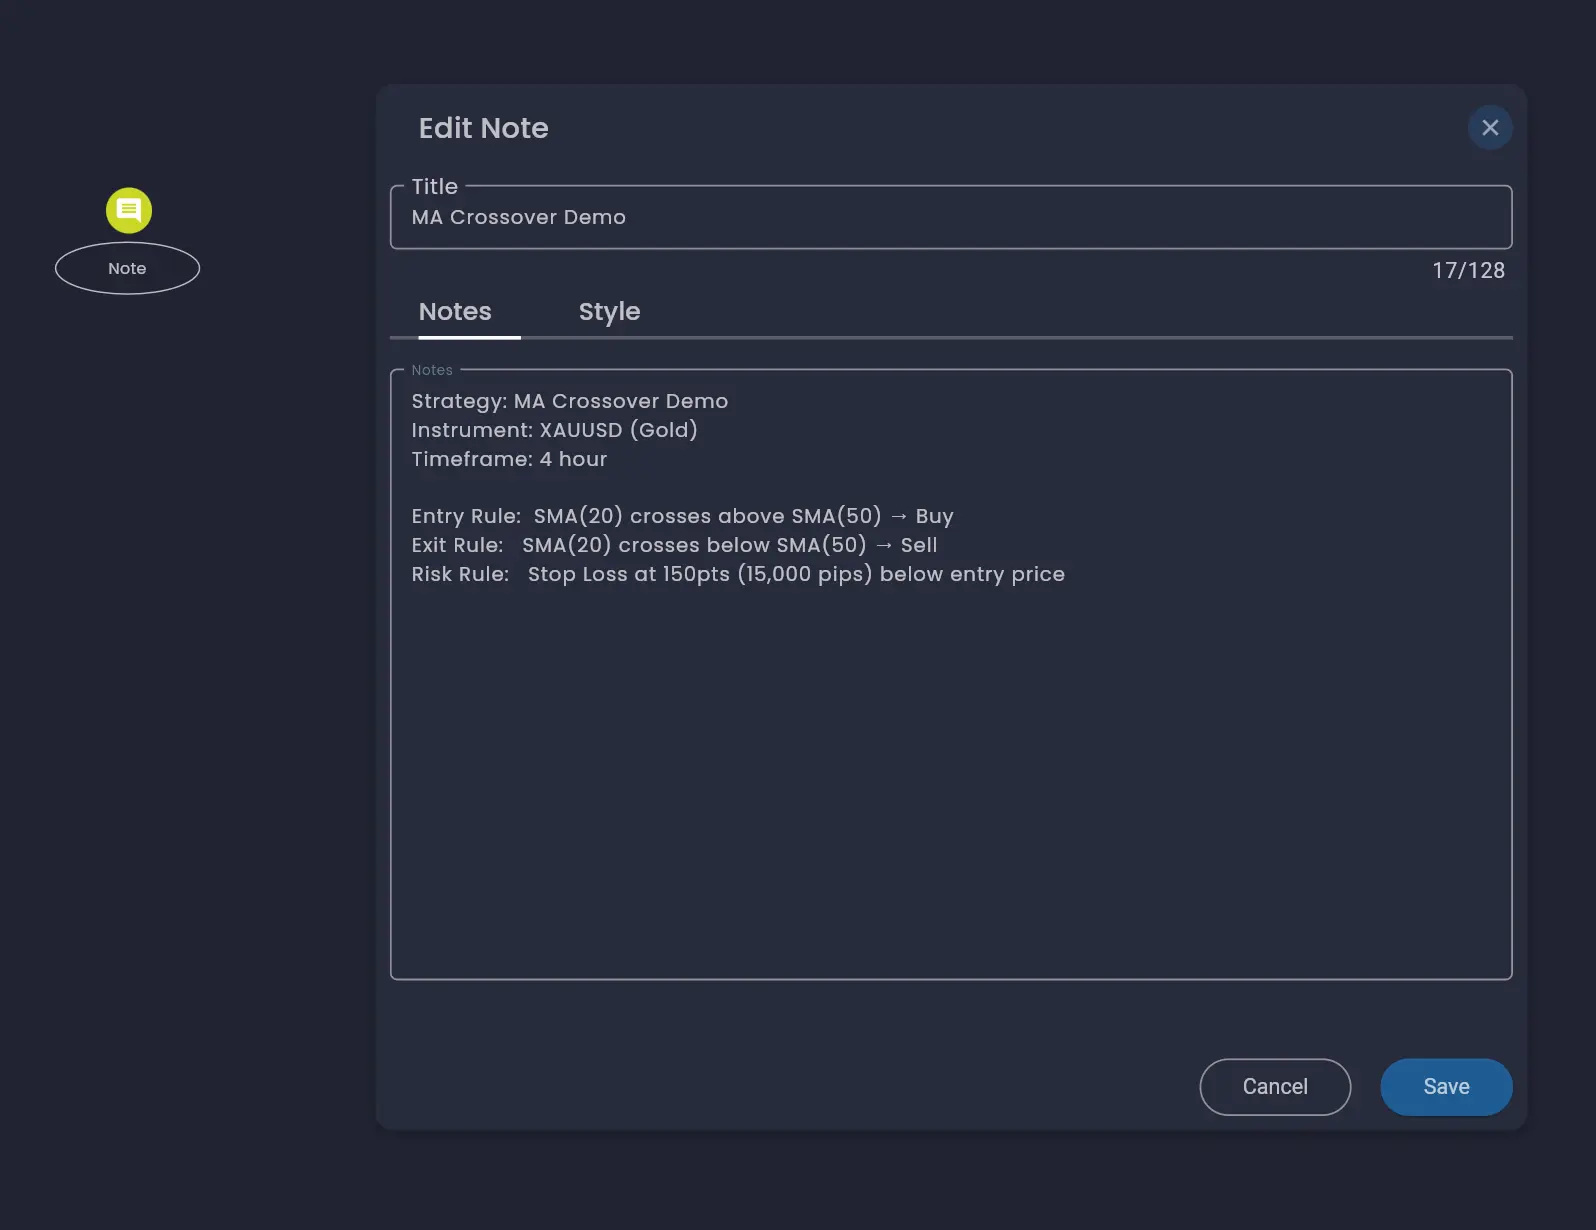
- Rules menu (left panel) — contains rule categories you can drag onto the canvas: Controls, Trade, State, Data, Time, Price, Math, and Indicators. There is also a search box to quickly find rules by name, and an Add Note button for documenting your strategy plan directly on the canvas.
- Canvas (centre) — the visual workspace where you arrange and connect rules.
- Toolbar (bottom) — canvas controls for zoom, undo/redo, save, grid layout and more.
You will notice two rules have been added to the canvas by default: Start Strategy and Trading Account. Every strategy requires both of these rules.
Step 2: Configure the Trading Account
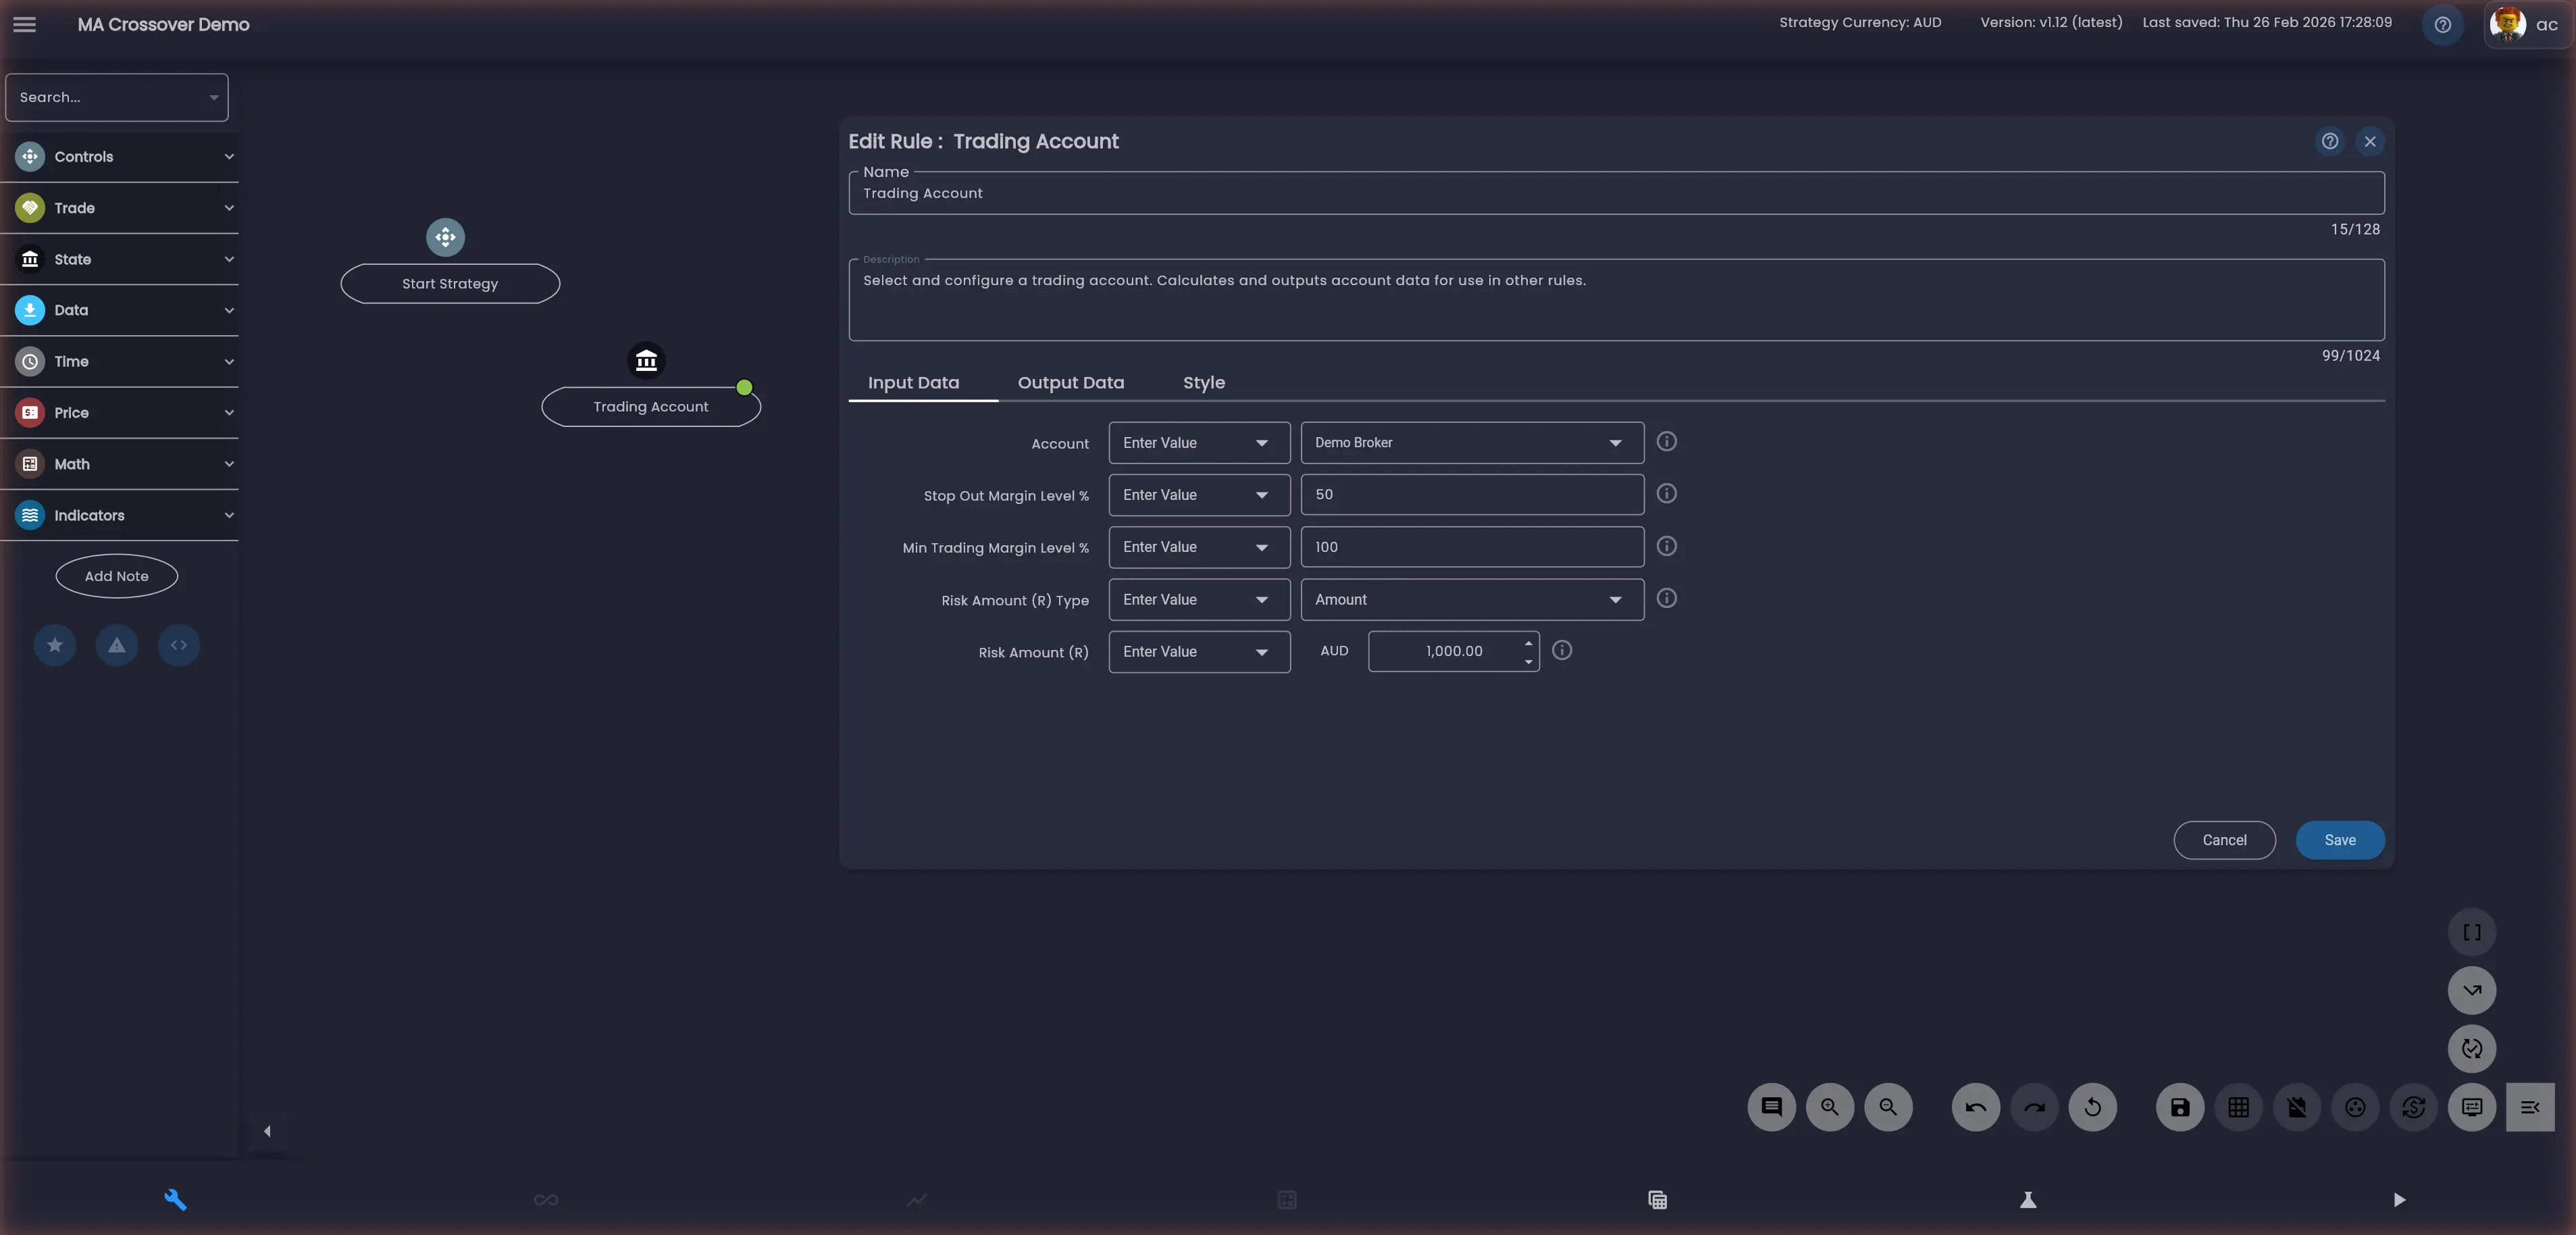
The Trading Account rule defines which broker account the strategy will trade on and sets the overall risk boundaries. Click the Trading Account rule on the canvas to select it, then click the edit (pen) icon to open the Edit Rule dialog.
Each rule has a Name and Description field at the top, followed by configuration tabs. The Trading Account rule has three tabs: Input Data, Output Data and Style.
Input Data
The Input Data tab contains the parameters that control how the rule behaves. Configure the following:
- Account — Select the broker account the strategy will trade on. The Demo Broker account is selected by default. If you have connected other broker accounts to your Arconomy profile, they will appear in this dropdown.
- Stop Out Margin Level % — The margin level at which Arconomy will begin closing positions from smallest to largest to reduce margin usage. This does not affect the broker’s own stop-out level, but allows you to close smaller positions before the broker closes the largest ones first. You should maintain sufficient capital in your account and manage risk in your strategy rules to avoid reaching this level.
- Min Trading Margin Level % — The minimum margin level required to open new positions. If the margin level falls below this threshold while trading, the strategy will stop opening new positions but will not close existing ones.
- Risk Amount (R) Type — Select
Amount. - Risk Amount (R) — The total capital you are willing to risk across all trades in this strategy. Think of it as an aggregate stop loss for the entire strategy. If this amount is reached the strategy will close all positions, cancel outstanding orders and stop running.
These parameters ensure the strategy operates within your predefined risk boundaries and does not impact other strategies running on your account.
Output Data
The Output Data tab shows all the data a rule publishes when it executes. This is an important concept in Arconomy: the output data from one rule can be used as input data or in execution logic by other rules. You can select any output field from the dropdown to see a description of what it provides. For example, the Trading Account rule publishes data such as Profit, Open Positions, Closed Positions and many more.
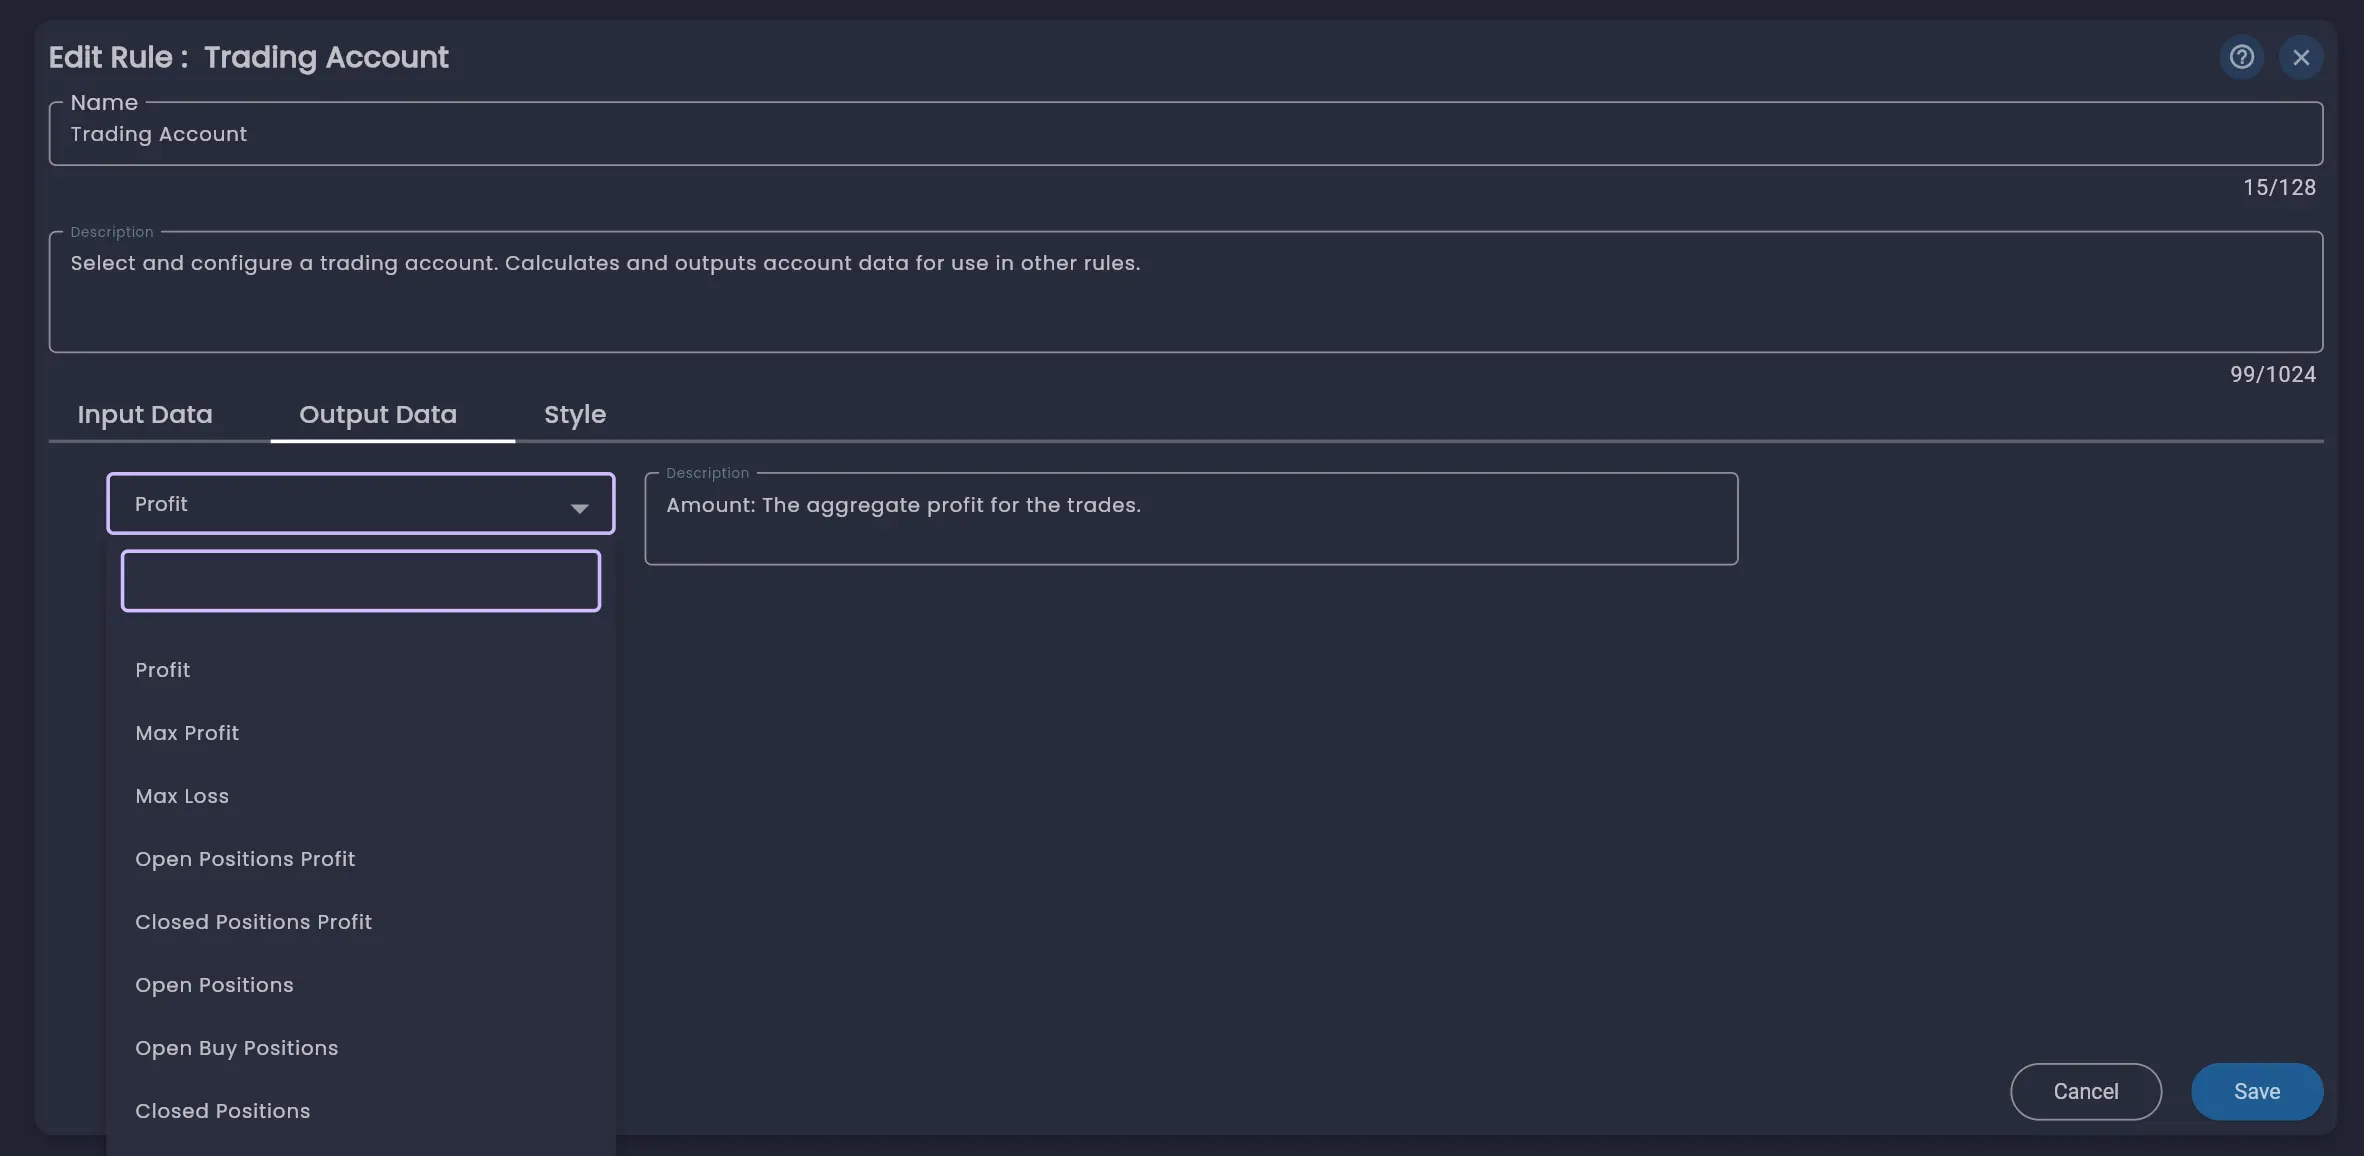
Click Save to save the Trading Account configuration. Once saved, your strategy is valid and you can start adding the trading behaviour.
Step 3: Configure the Start Strategy Rule
The Start Strategy rule determines when the strategy should be deployed. Click the Start Strategy rule on the canvas, then click the edit icon to open its configuration.
The key input field is Start Immediately, which is enabled by default. This means the strategy will begin running as soon as it is deployed.
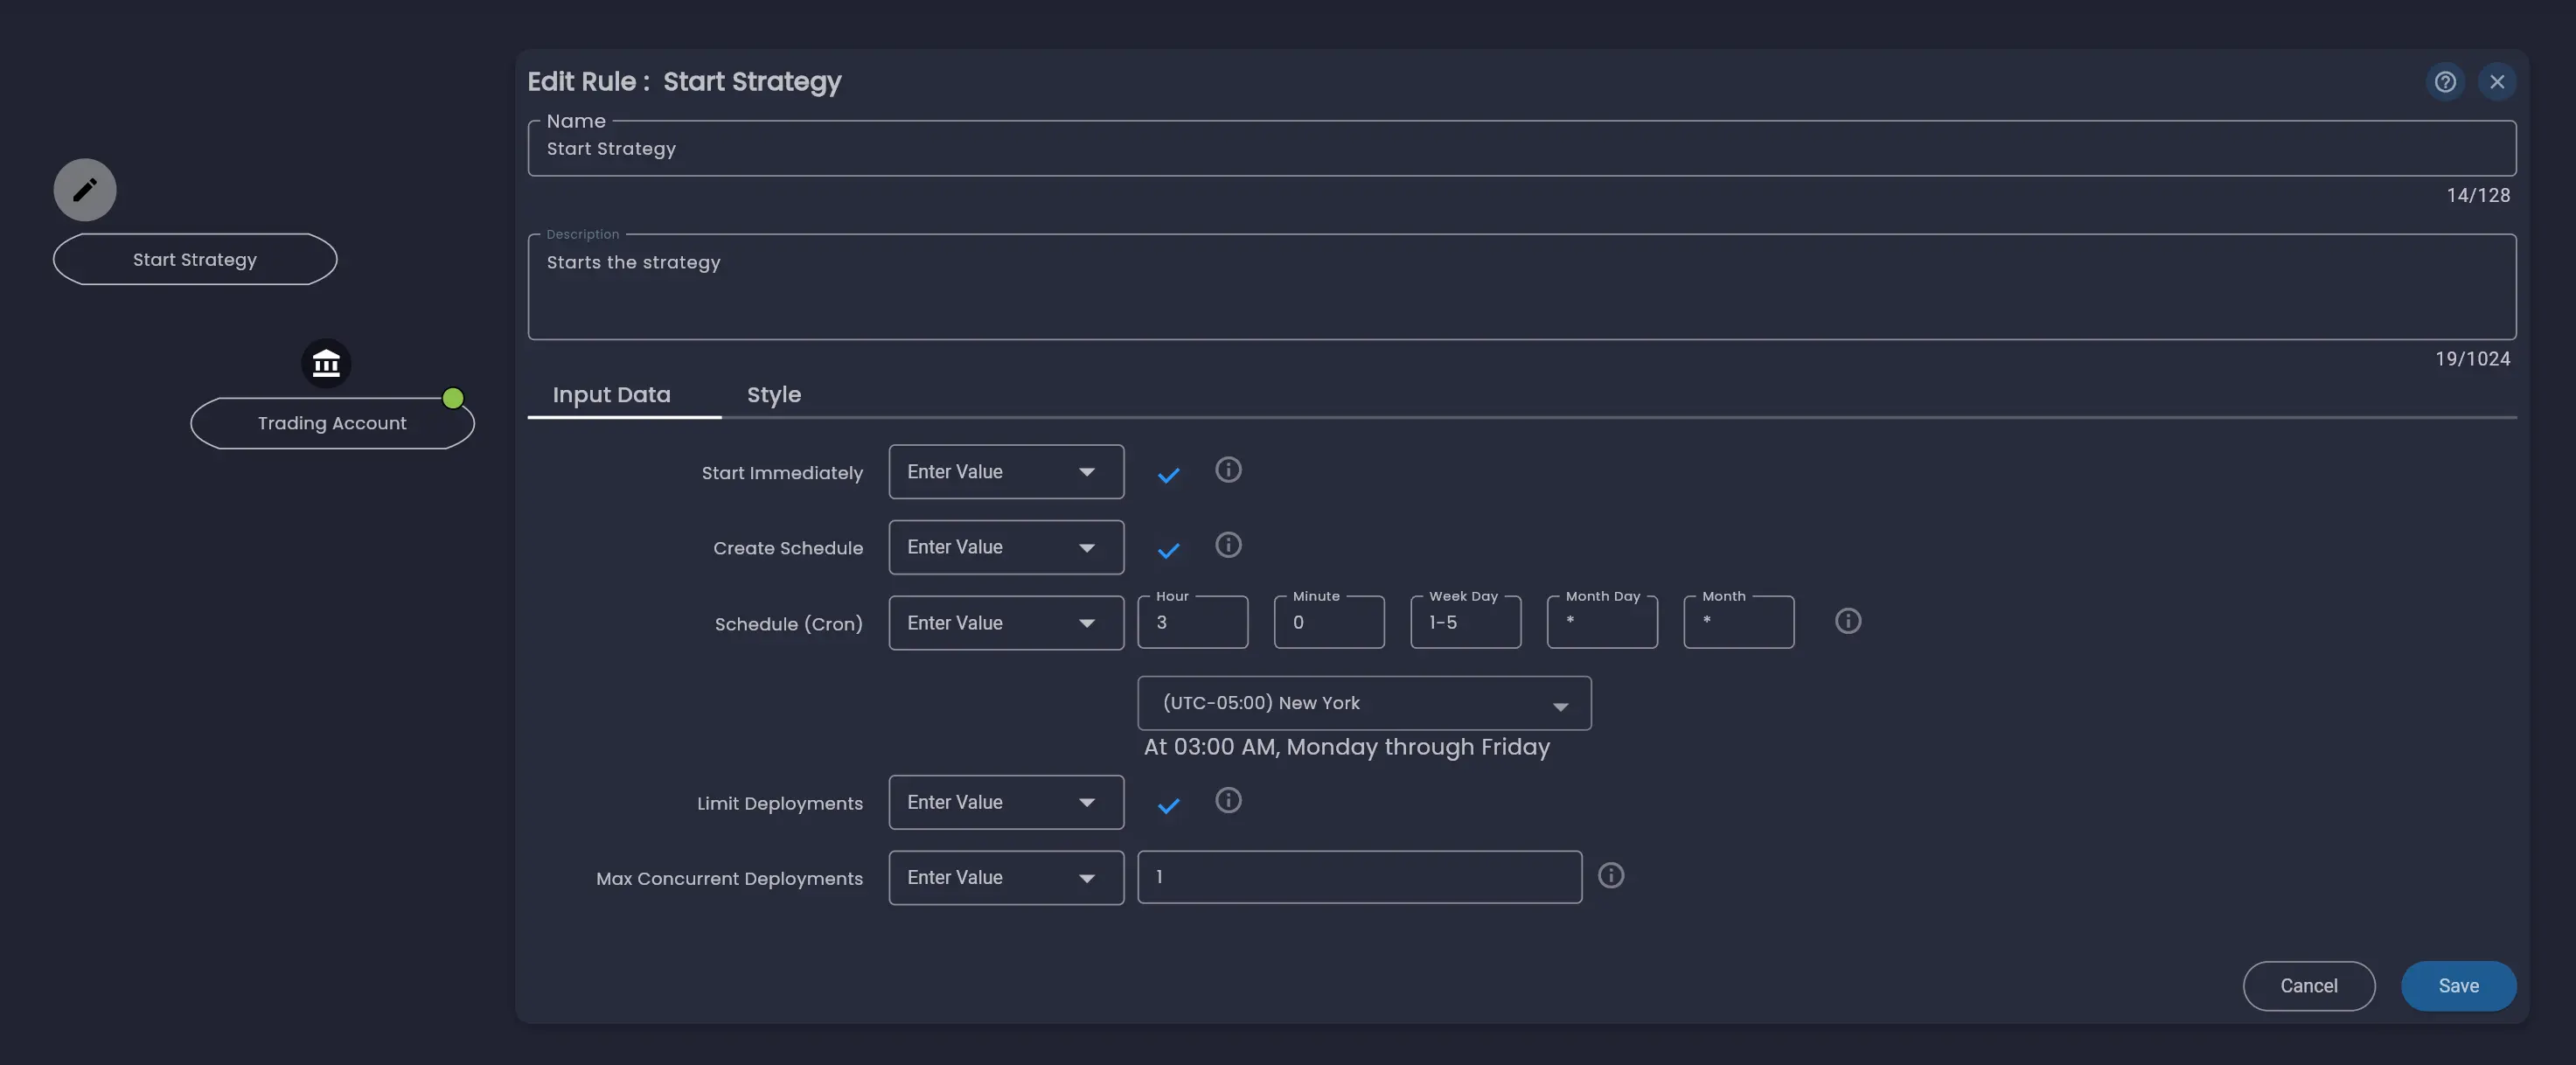
For more advanced use cases, you can configure a schedule using the Create Schedule and Schedule (Cron) fields to deploy the strategy at a specific time or on a recurring basis. If using a schedule, you can also enable Limit Deployments to cap the maximum number of strategy instances running concurrently.
For this tutorial, the defaults are fine. Click Save.
Step 4: Add the Price Data Rule
The strategy needs market data to work with. In the rules menu on the left, expand the Data category and drag the Price Data rule onto the canvas.
Click the Price Data rule on the canvas, then click the edit icon. Configure the following fields on the Input Data tab:
- Symbol — Select your broker account (e.g. Demo Broker) and then select
XAUUSDfrom the instrument dropdown. - Period — Select
Hours. - Frequency — Set to
4. This gives us 4-hour candles.
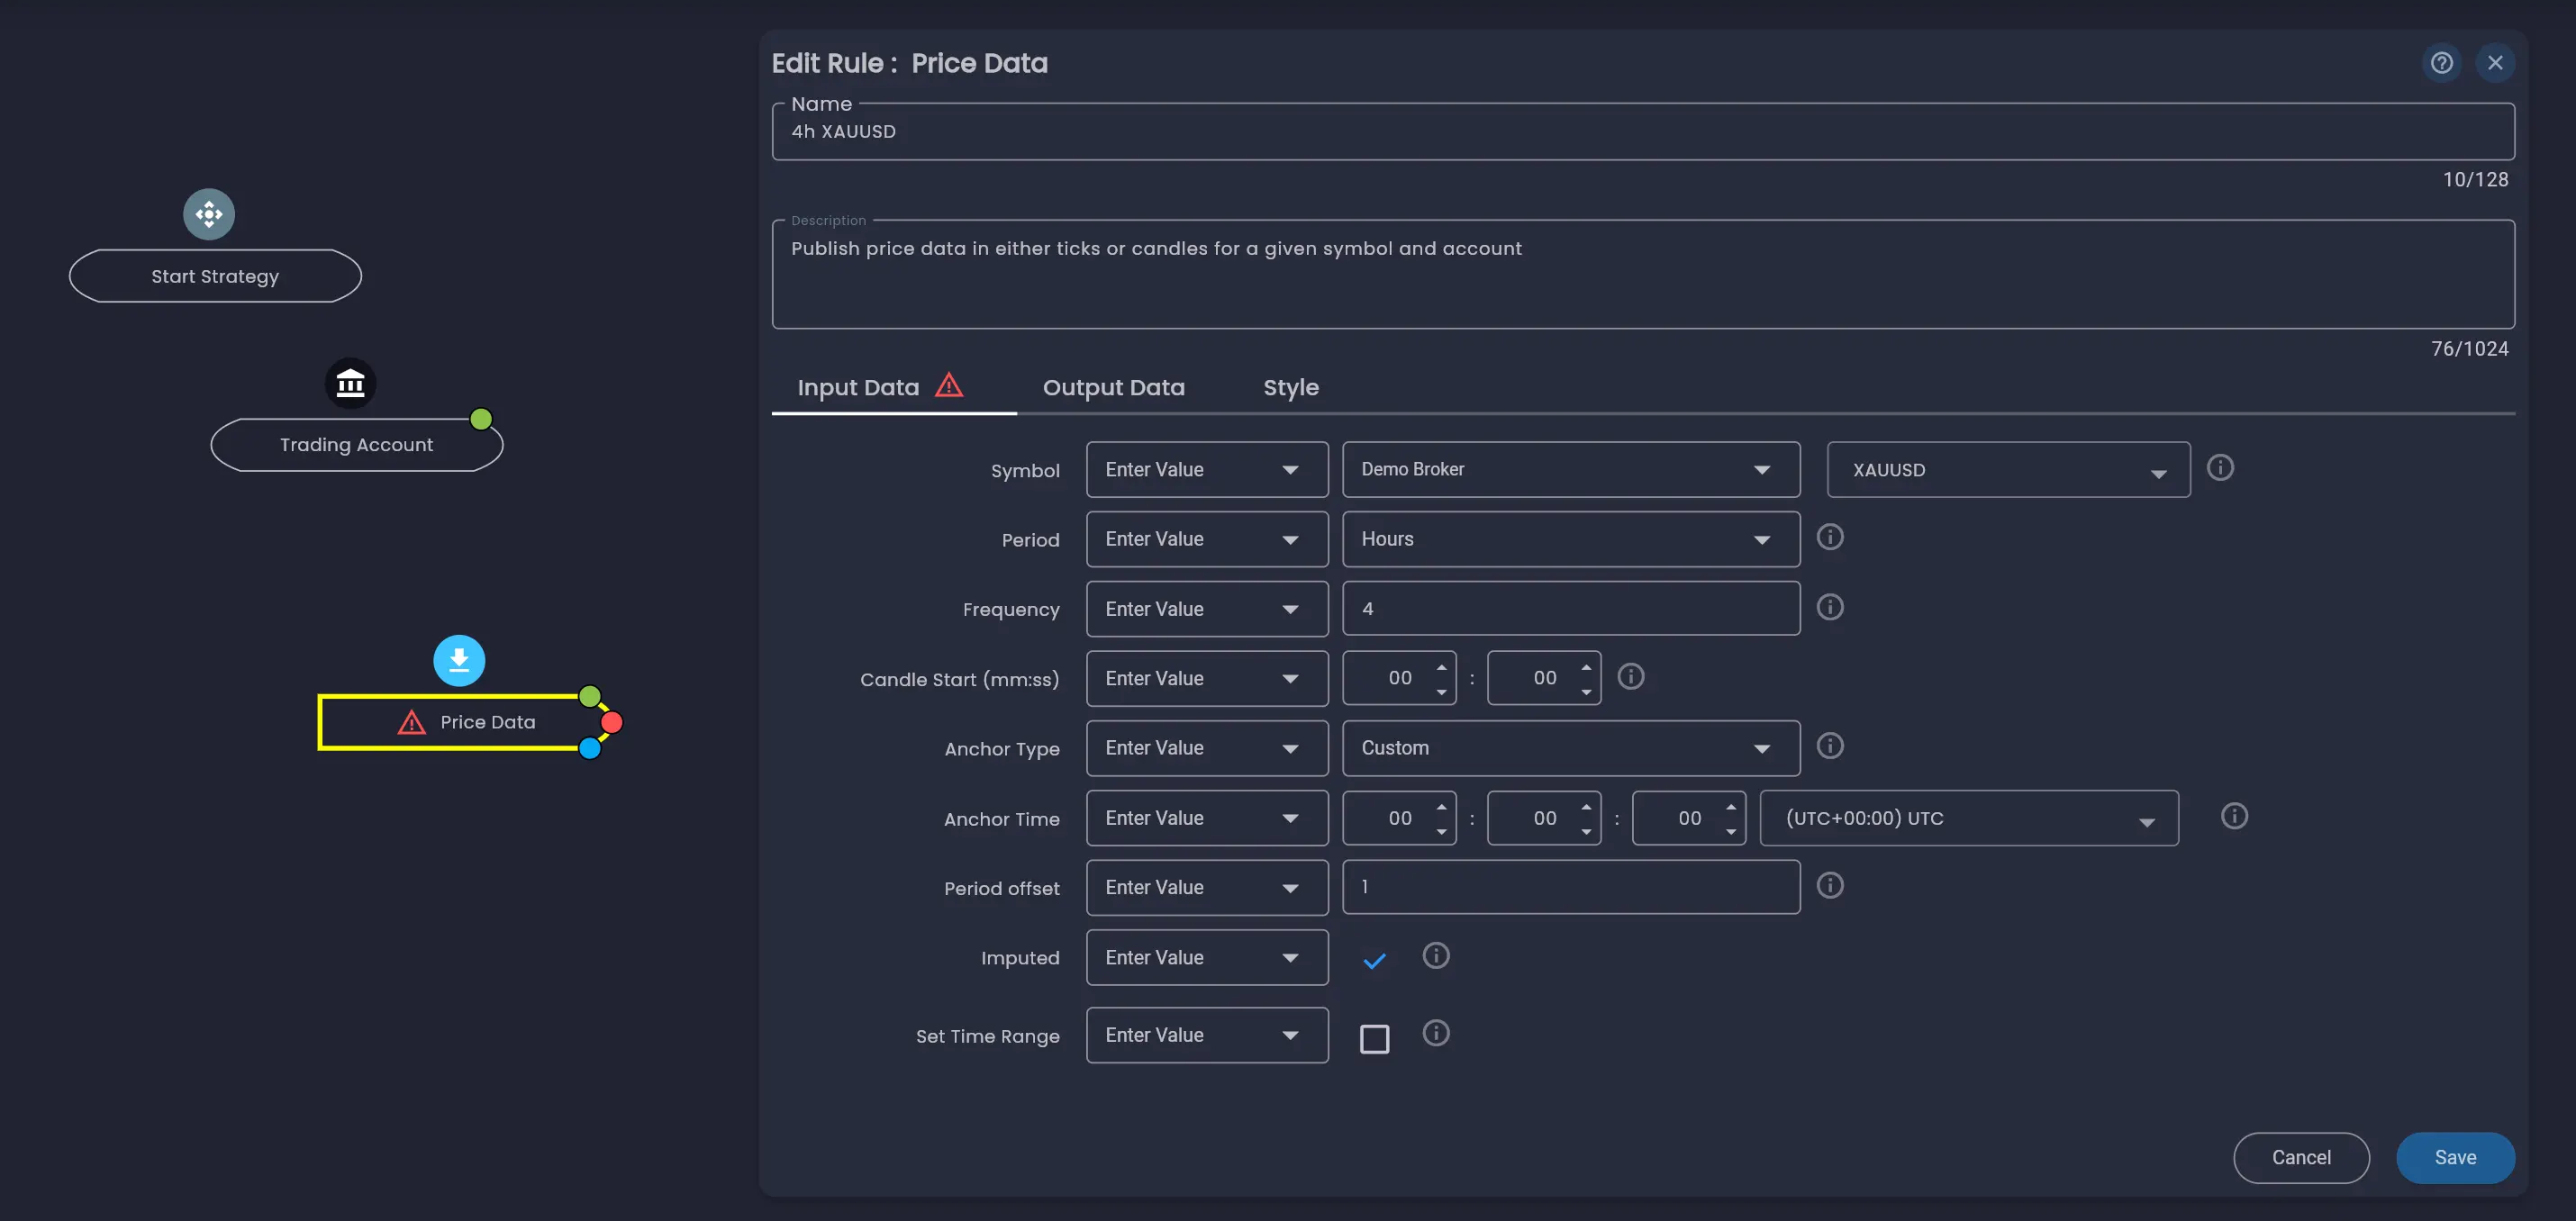
The remaining fields (Candle Start, Anchor Type, Anchor Time, Period Offset, Imputed, Set Time Range) can be left at their defaults for this tutorial. For a detailed explanation of all Price Data fields, see the Price Data rule documentation.
Give your rules descriptive names. For example, rename this rule to "XAUUSD 4h" so it is easy to identify on the canvas. You can rename any rule in the Name field at the top of the Edit Rule dialog.
The Price Data rule is a Data Source rule, which means it is triggered by external market data rather than by other rules in the execution chain. This distinction will become important when connecting other rules to it.
For this tutorial we are using a single symbol to keep things simple. You can add multiple symbols to a strategy later — see Multi-Symbol Strategies for details.
Click Save.
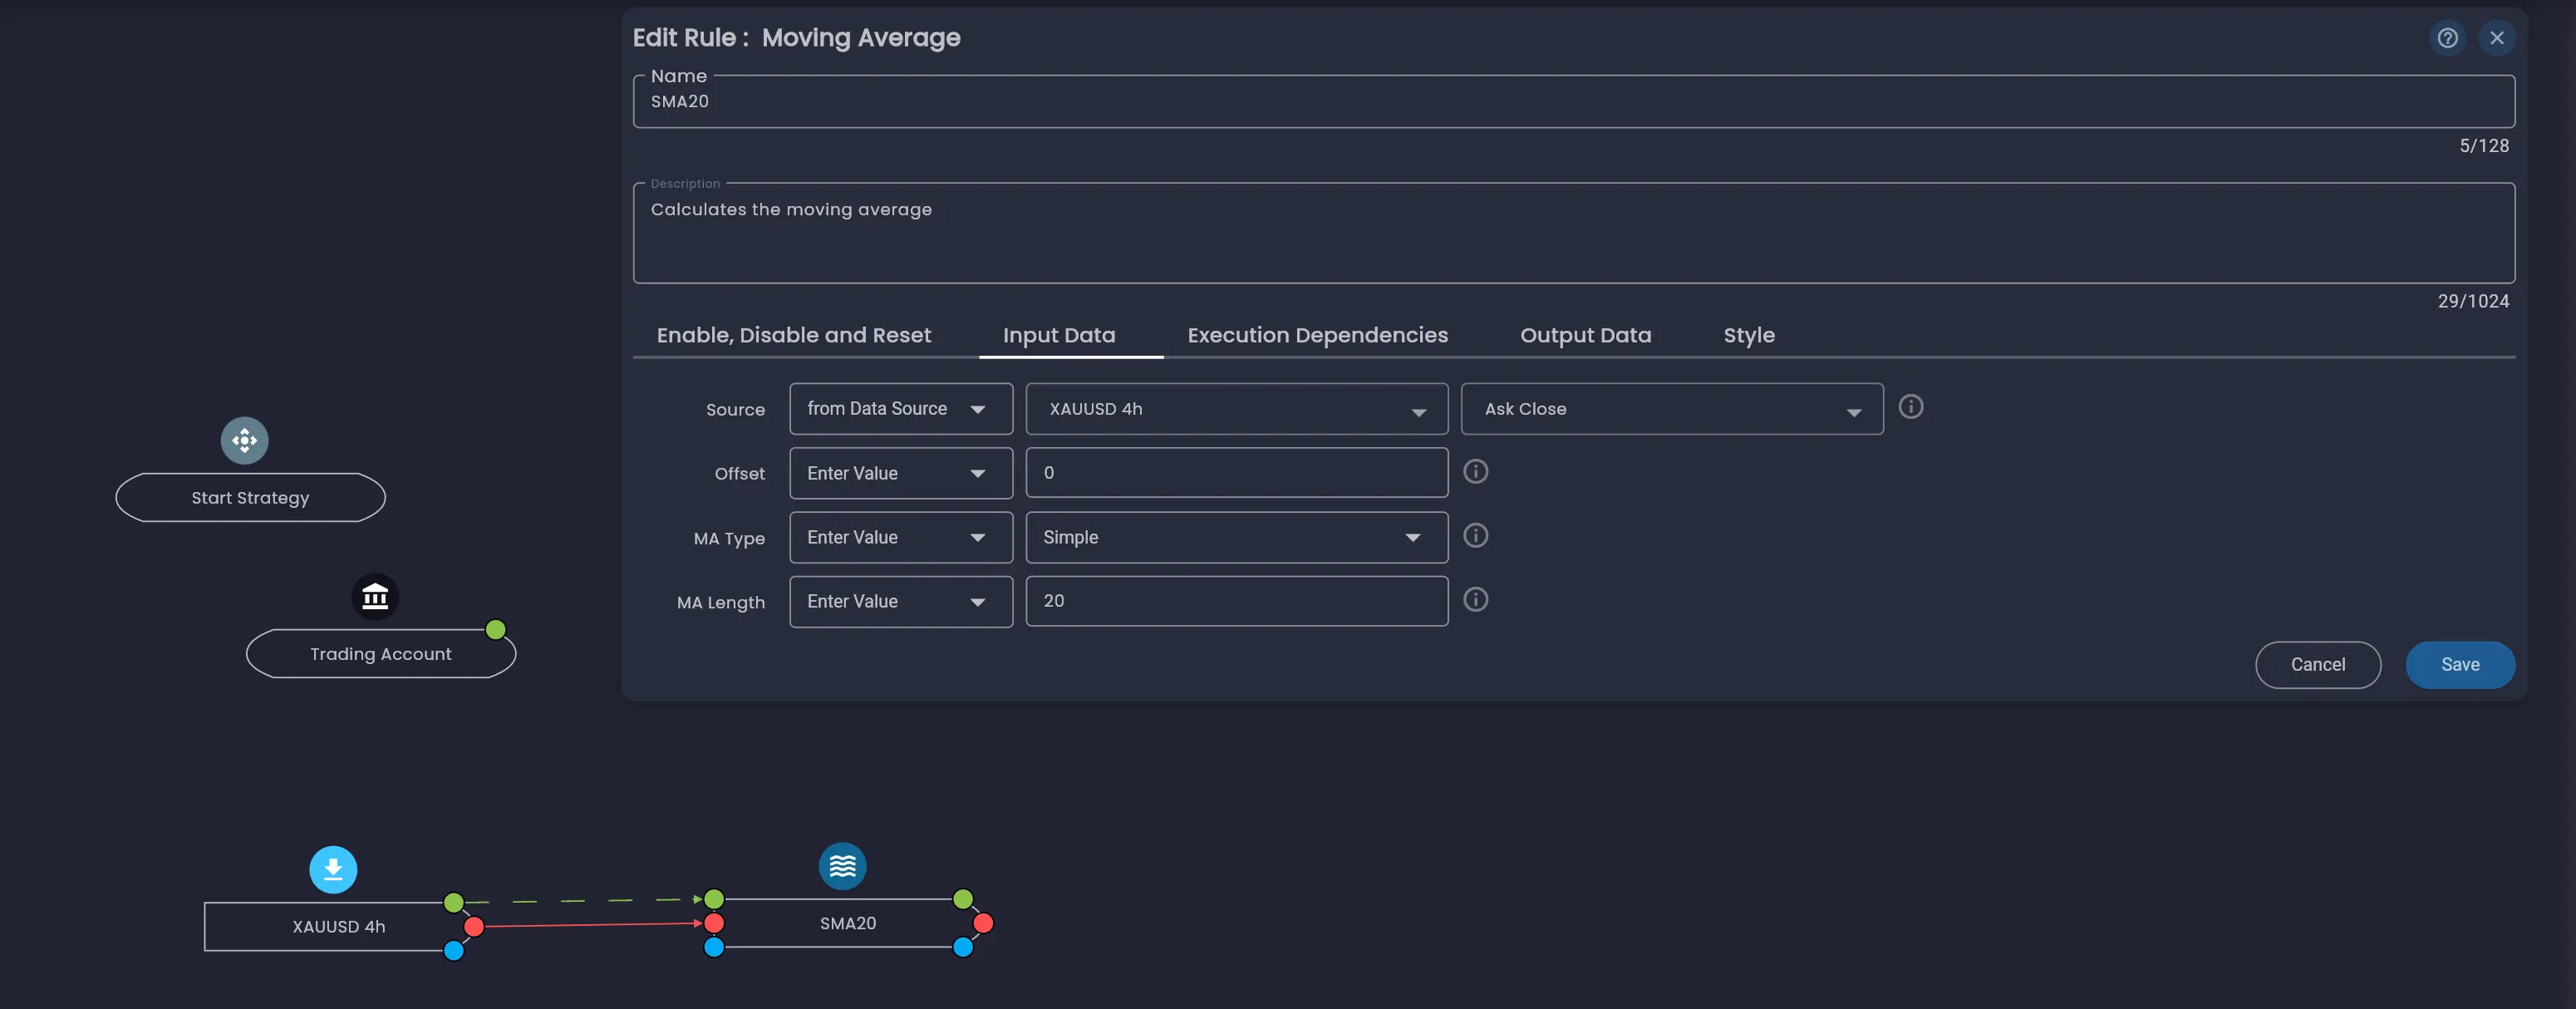
Step 5: Add the SMA 20 Moving Average
Now we need to calculate the moving averages that will drive our entry and exit decisions. In the rules menu, use the search box to search for "moving average". You will find the Moving Average rule under the Indicators category. Drag it onto the canvas.
Click the rule and open the Edit Rule dialog. Rename it to "SMA20", then configure the Input Data tab:
- Source — Change the first dropdown from "from Rule" to
from Data Source, since the Price Data rule is a Data Source. Then selectXAUUSD 4h(your Price Data rule) andAsk Closeas the price field. - Offset — Leave at
0. - MA Type — Select
Simple. - MA Length — Set to
20.
Execution Dependencies
Switch to the Execution Dependencies tab. This tab defines the order in which rules execute. Set the SMA20 rule to execute AFTER the XAUUSD 4h Price Data rule. This ensures the price data is available before the moving average is calculated.
Execution dependencies are a core concept in Arconomy and are covered in detail in the Execution Dependencies documentation.
Click Save.
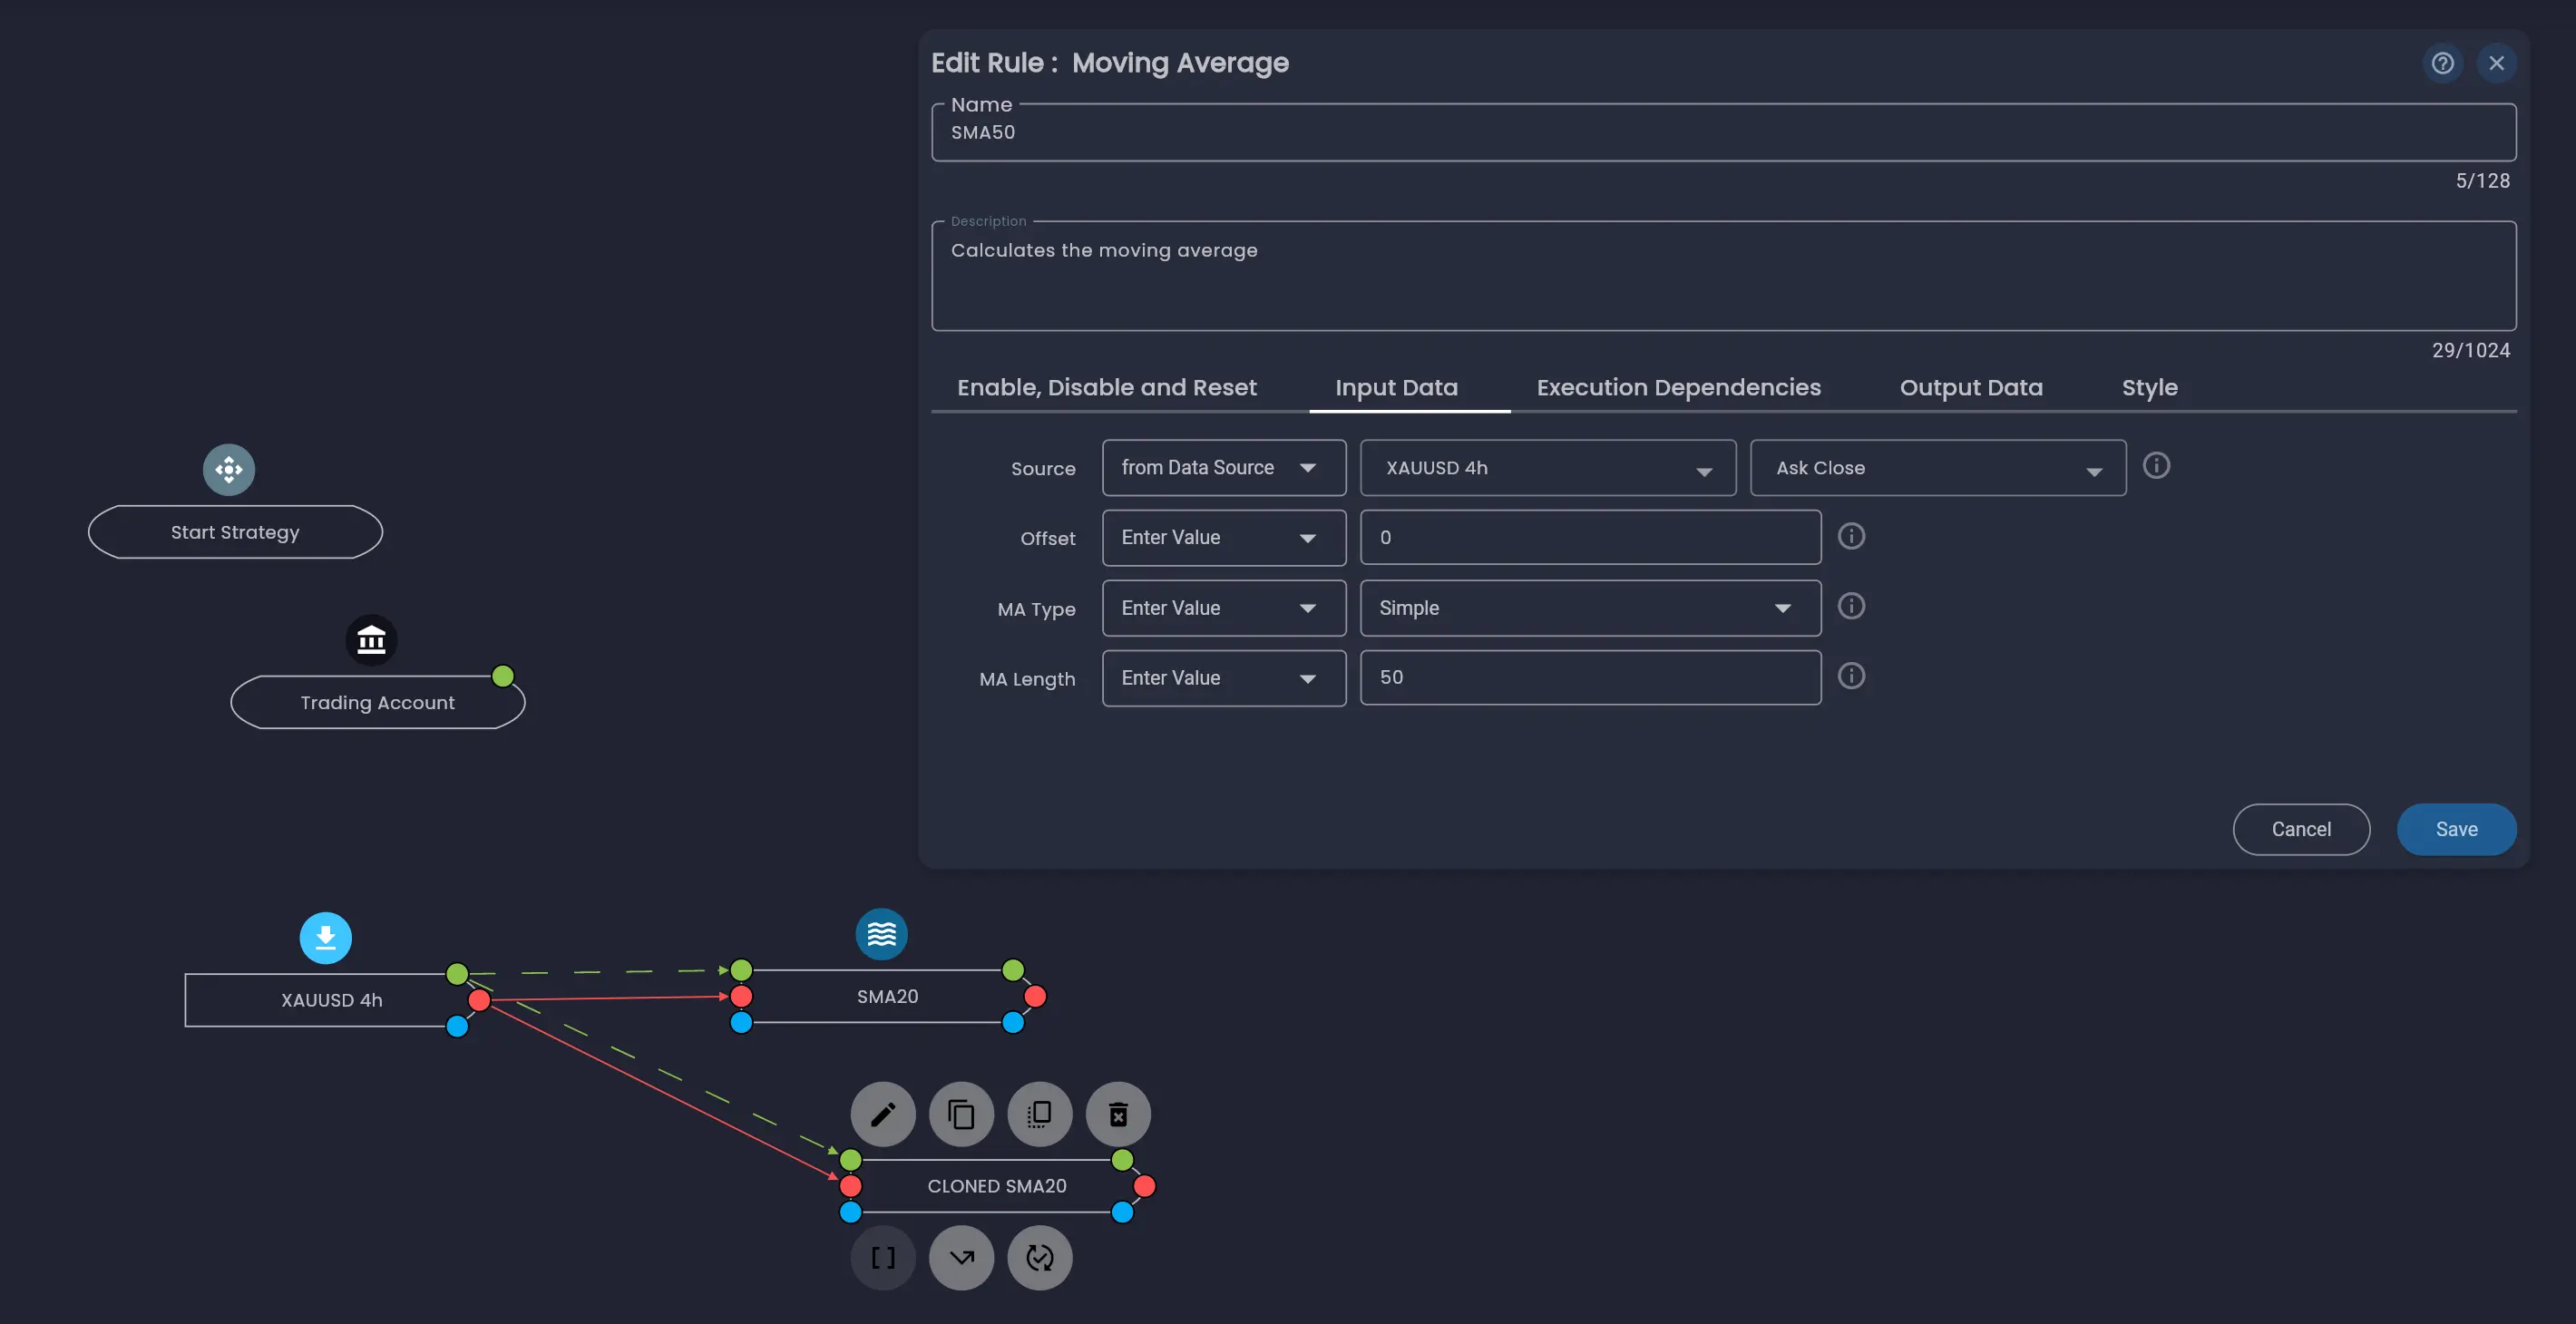
Step 6: Clone to Create SMA 50
Rather than configuring a second Moving Average rule from scratch, you can clone the SMA20 rule. Click on the SMA20 rule on the canvas to select it, then click the clone icon in the action bar above the rule. This creates a duplicate with all the same configuration, including the data source reference and execution dependencies.
Open the cloned rule and update two fields:
- Name — Change to
SMA50. - MA Length — Change to
50.
Everything else (Source, MA Type, Execution Dependencies) remains the same. Click Save.
Step 7: Add the Entry Logic
Now it is time to define when the strategy should open a position. In the rules menu, search for "place trade". Under the Trade category, drag the Place Trade (r) rule onto the canvas. The "(r)" indicates this is a risk-based trade rule that works with the Risk Amount configured in the Trading Account rule.
Input Data
Configure the Input Data tab with the following:
- Symbol — Select your broker and
XAUUSD. - Side — Select
Buy. - Order Type — Select
Market.
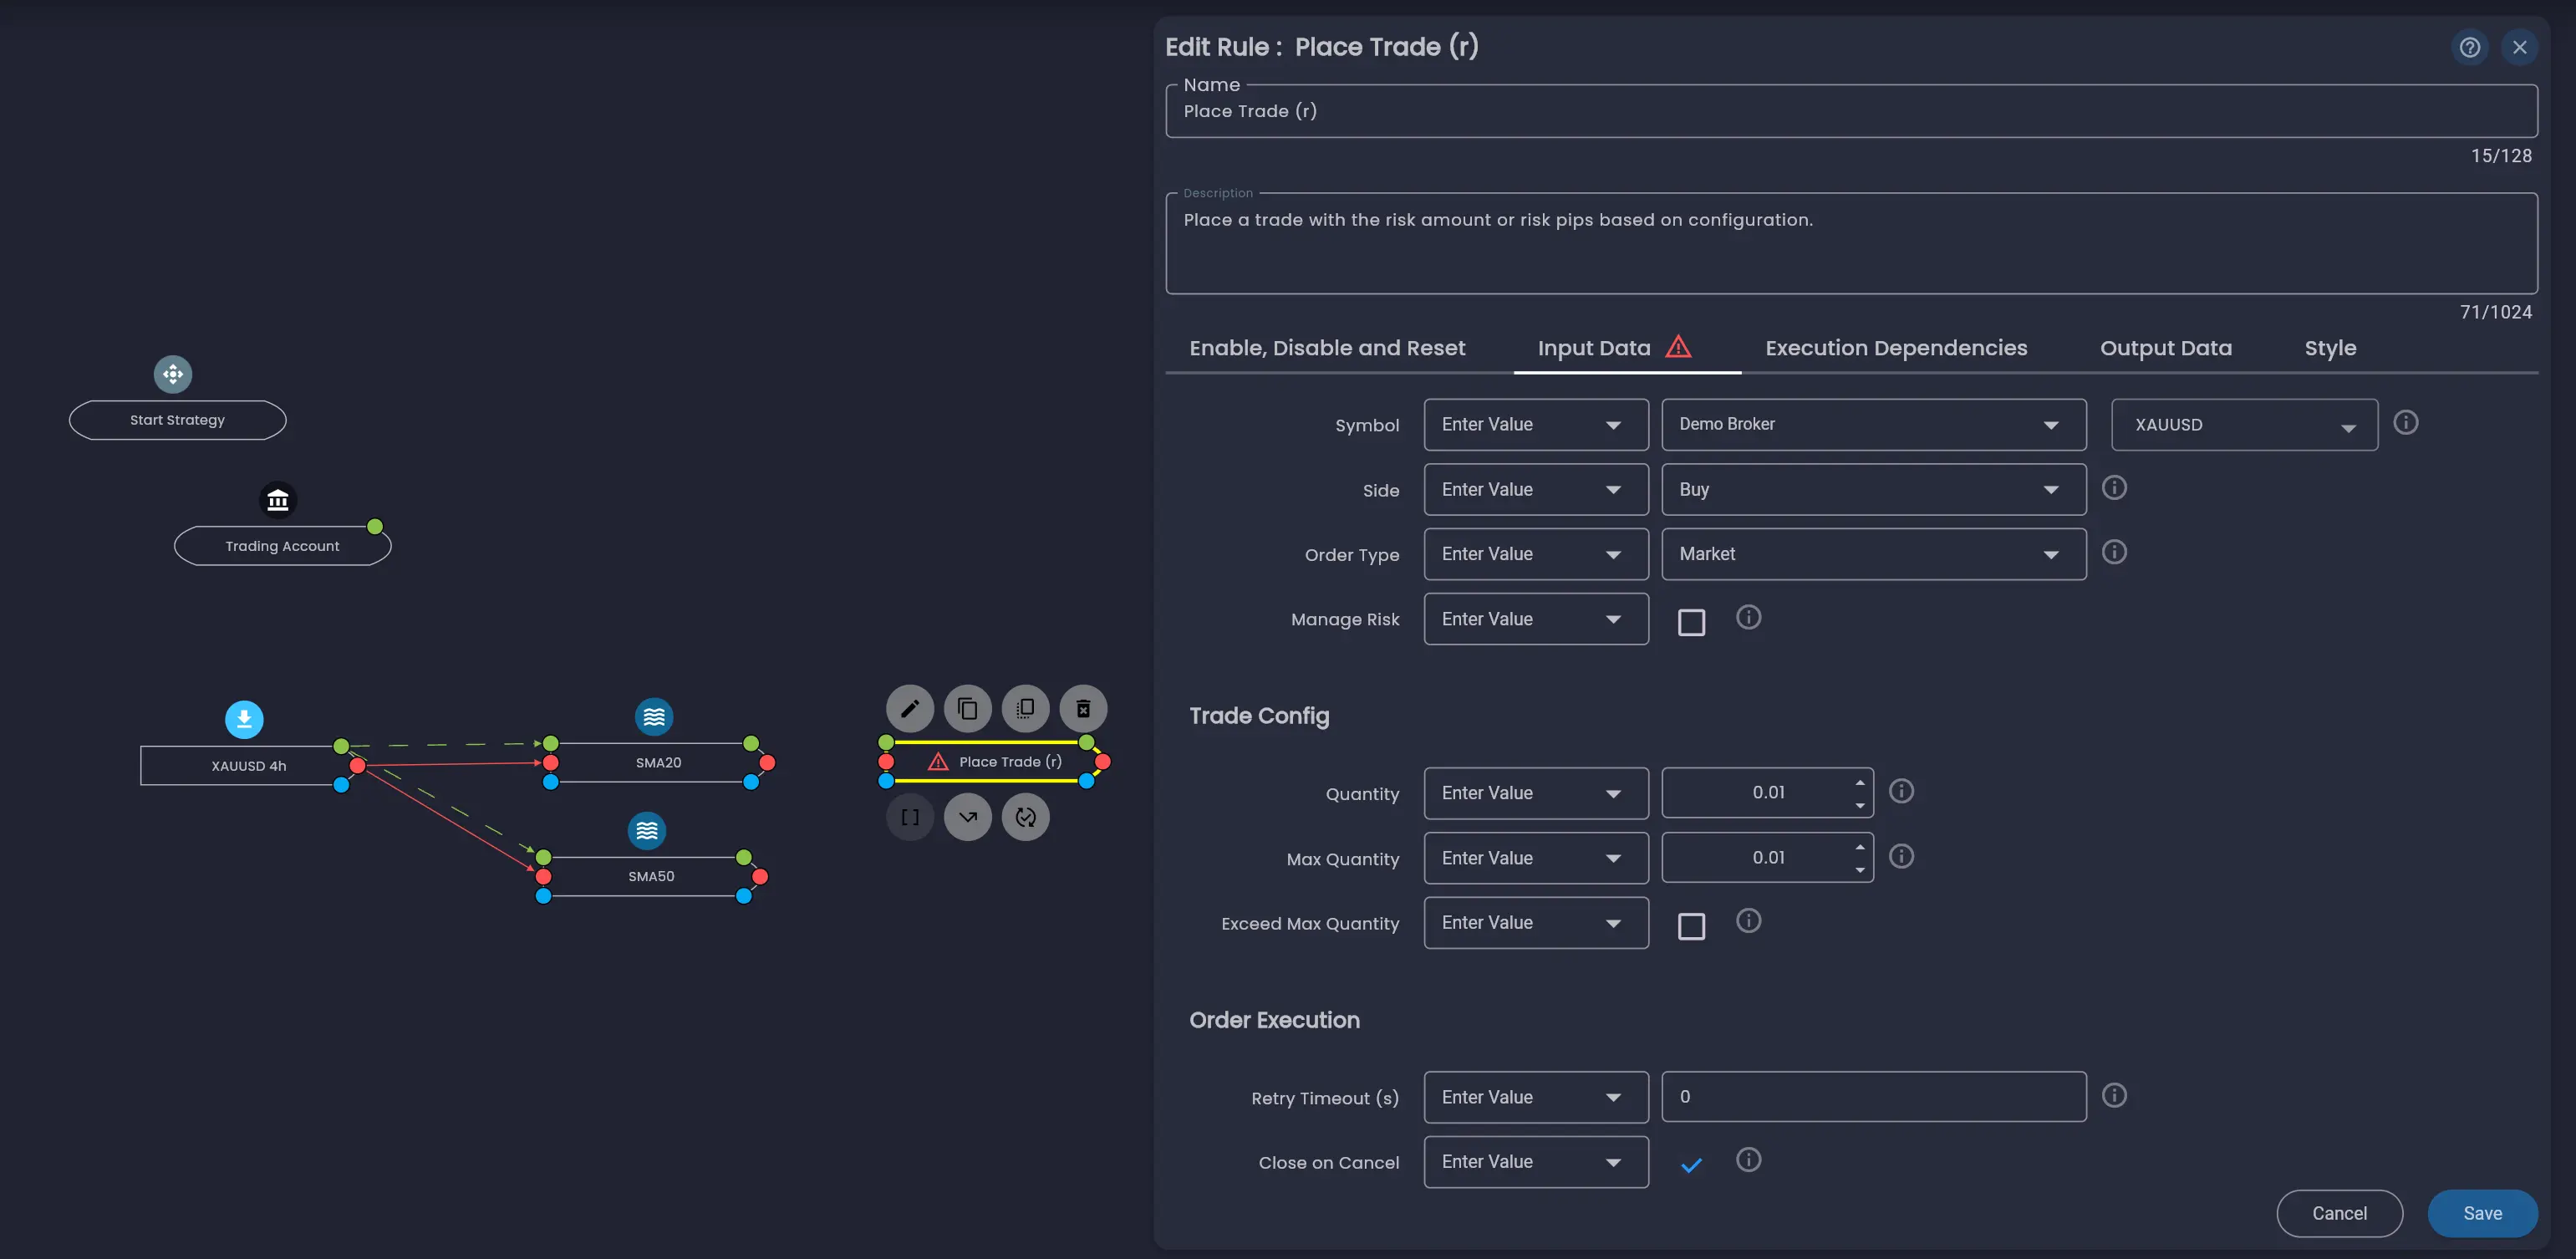
The remaining fields (Manage Risk, Trade Config, Order Execution) can be left at their defaults for this tutorial. For a detailed explanation of all fields, see the Place Trade (r) rule documentation.
Execution Dependencies with Conditional Logic
Switch to the Execution Dependencies tab. This is where the entry logic is defined. Set up the following:
- Execute — AFTER
SMA20. - Condition — AND IF
SMA20→ Moving Average > Value →SMA50→ Moving Average.
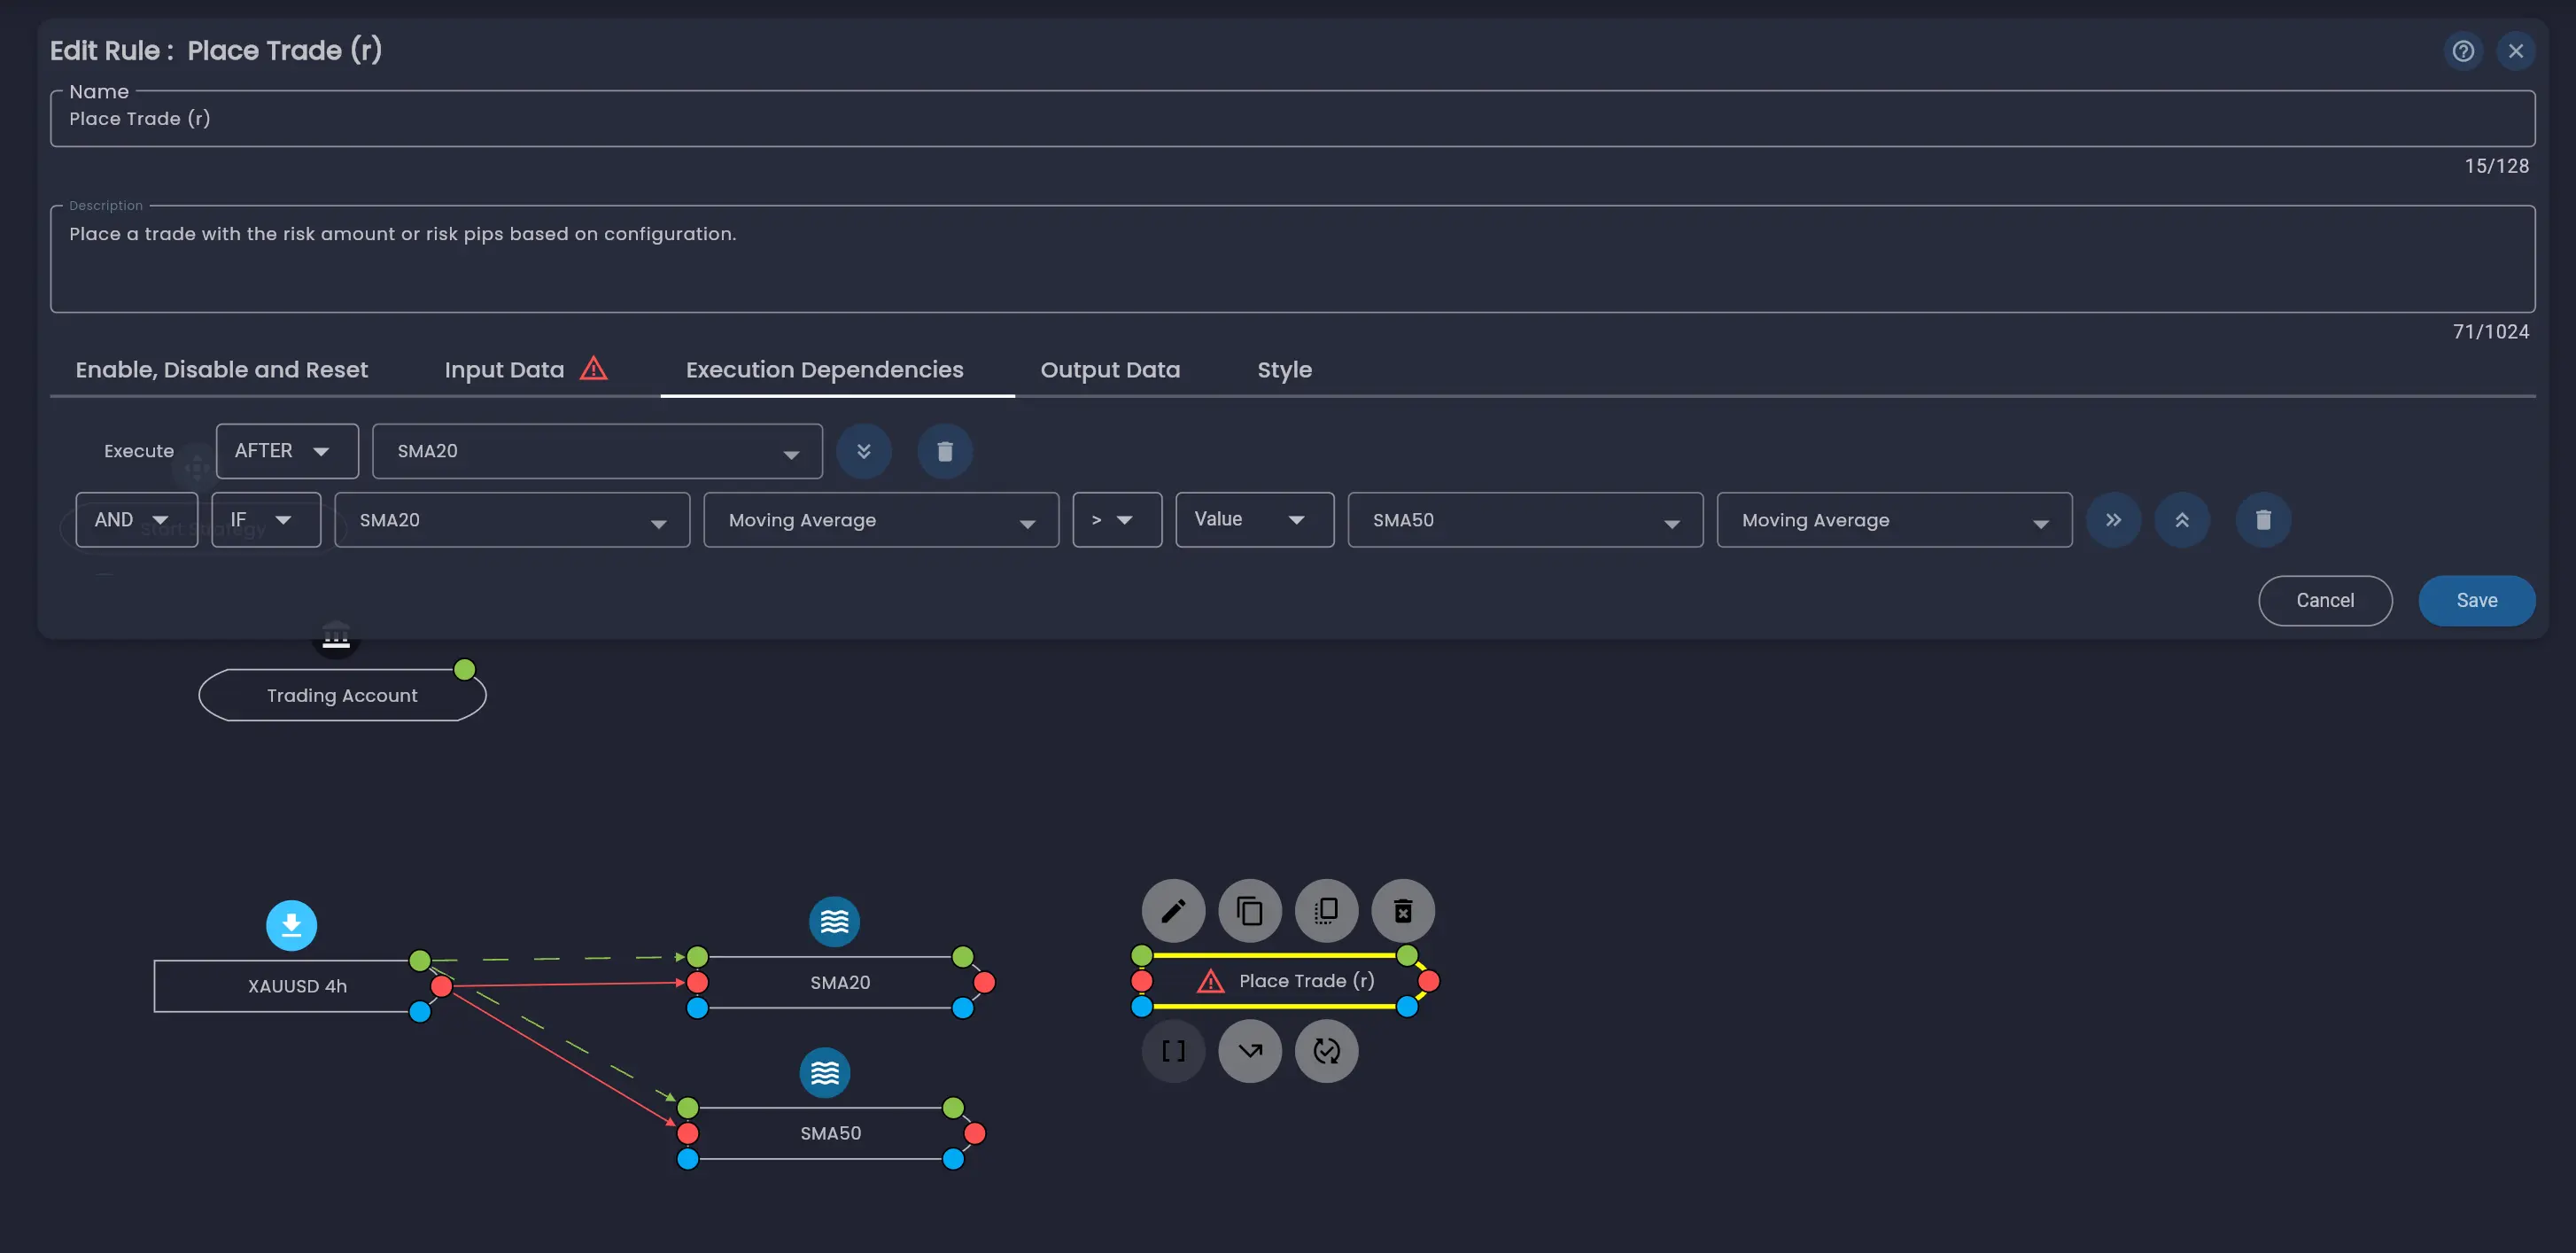
This reads: Execute this trade after the SMA20 rule, but only if the SMA20 moving average value is greater than the SMA50 moving average value. In other words, the strategy will place a buy trade when the fast moving average is above the slow moving average, indicating bullish momentum.
Enable, Disable and Reset
Switch to the Enable, Disable and Reset tab. By default, trade rules are configured with:
- Enabled Before Execution — On. The rule starts in an enabled state.
- Disabled After Execution — On. The rule disables itself after it executes once.
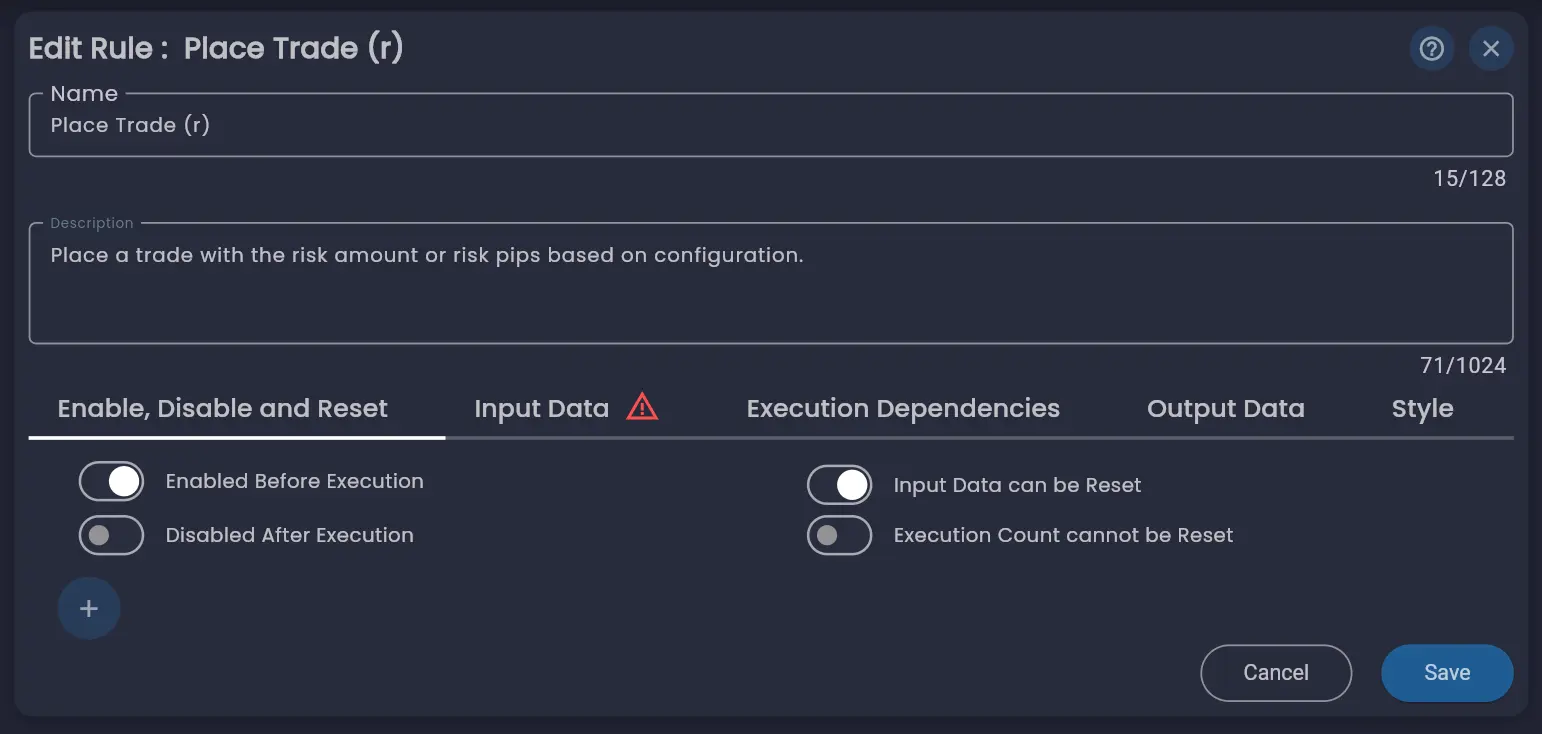
This means the Place Trade (r) rule will only place a single trade. For this tutorial that is fine. If you want a strategy that re-enters the market after exiting, you would need to adjust this configuration or have another rule re-enable the trade rule.
Click Save.
Step 8: Add the Stop Loss
A strategy without risk management exposes you to unlimited downside on any individual trade. In the rules menu, search for "stop loss". Under the Trade category, drag the Stop Loss rule onto the canvas.
Configure the Input Data tab:
- Trade Id(s) — Change to "from Rule", then select
Place Trade (r)andTrade Id. This tells the stop loss which trade to protect. - Type — Select
Pips. - Pips — Set to
15000. For XAUUSD this equals $150 below the entry price.
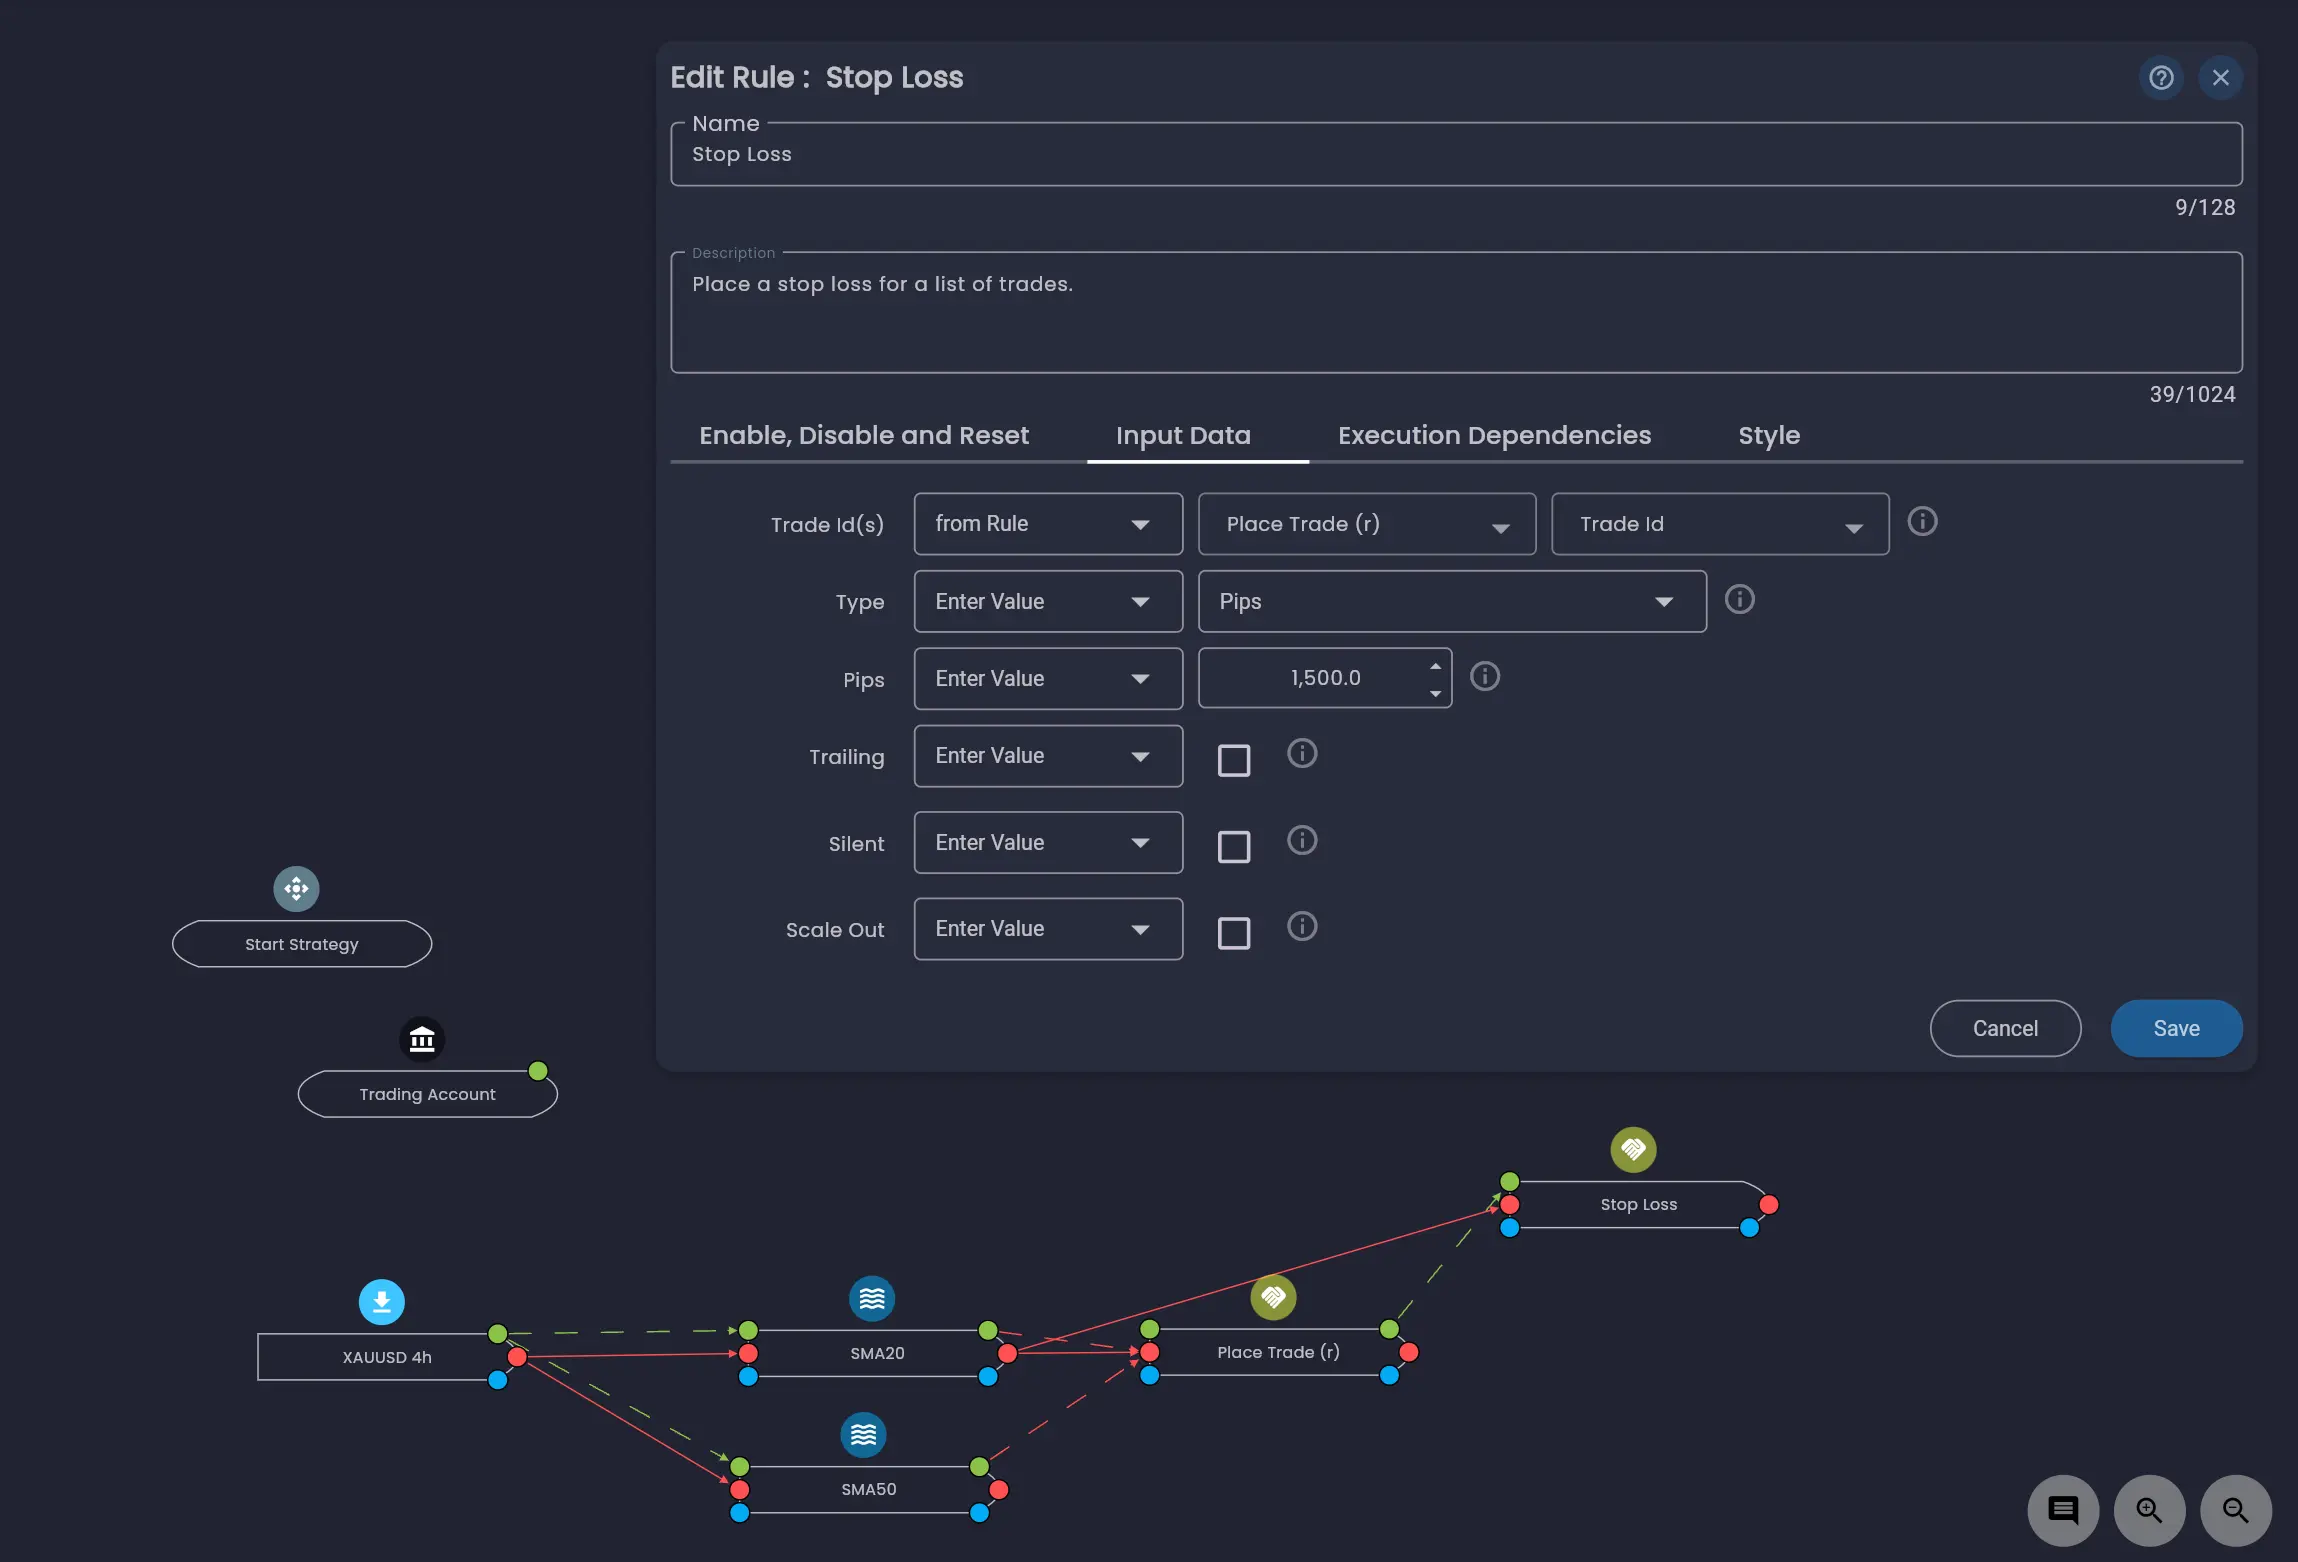
The remaining fields (Trailing, Silent, Scale Out) provide more advanced stop loss behaviour and can be left at their defaults. For a detailed explanation, see the Stop Loss rule documentation.
Switch to the Execution Dependencies tab and set it to execute AFTER
Place Trade (r). This ensures the stop loss is placed immediately after the trade is
opened.
Click Save.
Always include at least one risk management rule in your strategies. Trading without a stop loss means a single adverse move could result in a loss far larger than expected. The stop loss is your safety net.
Step 9: Add the Exit Logic
Finally, define when the strategy should close the position. In the rules menu, search for "close". Under the Trade category, drag the Close Positions rule onto the canvas.
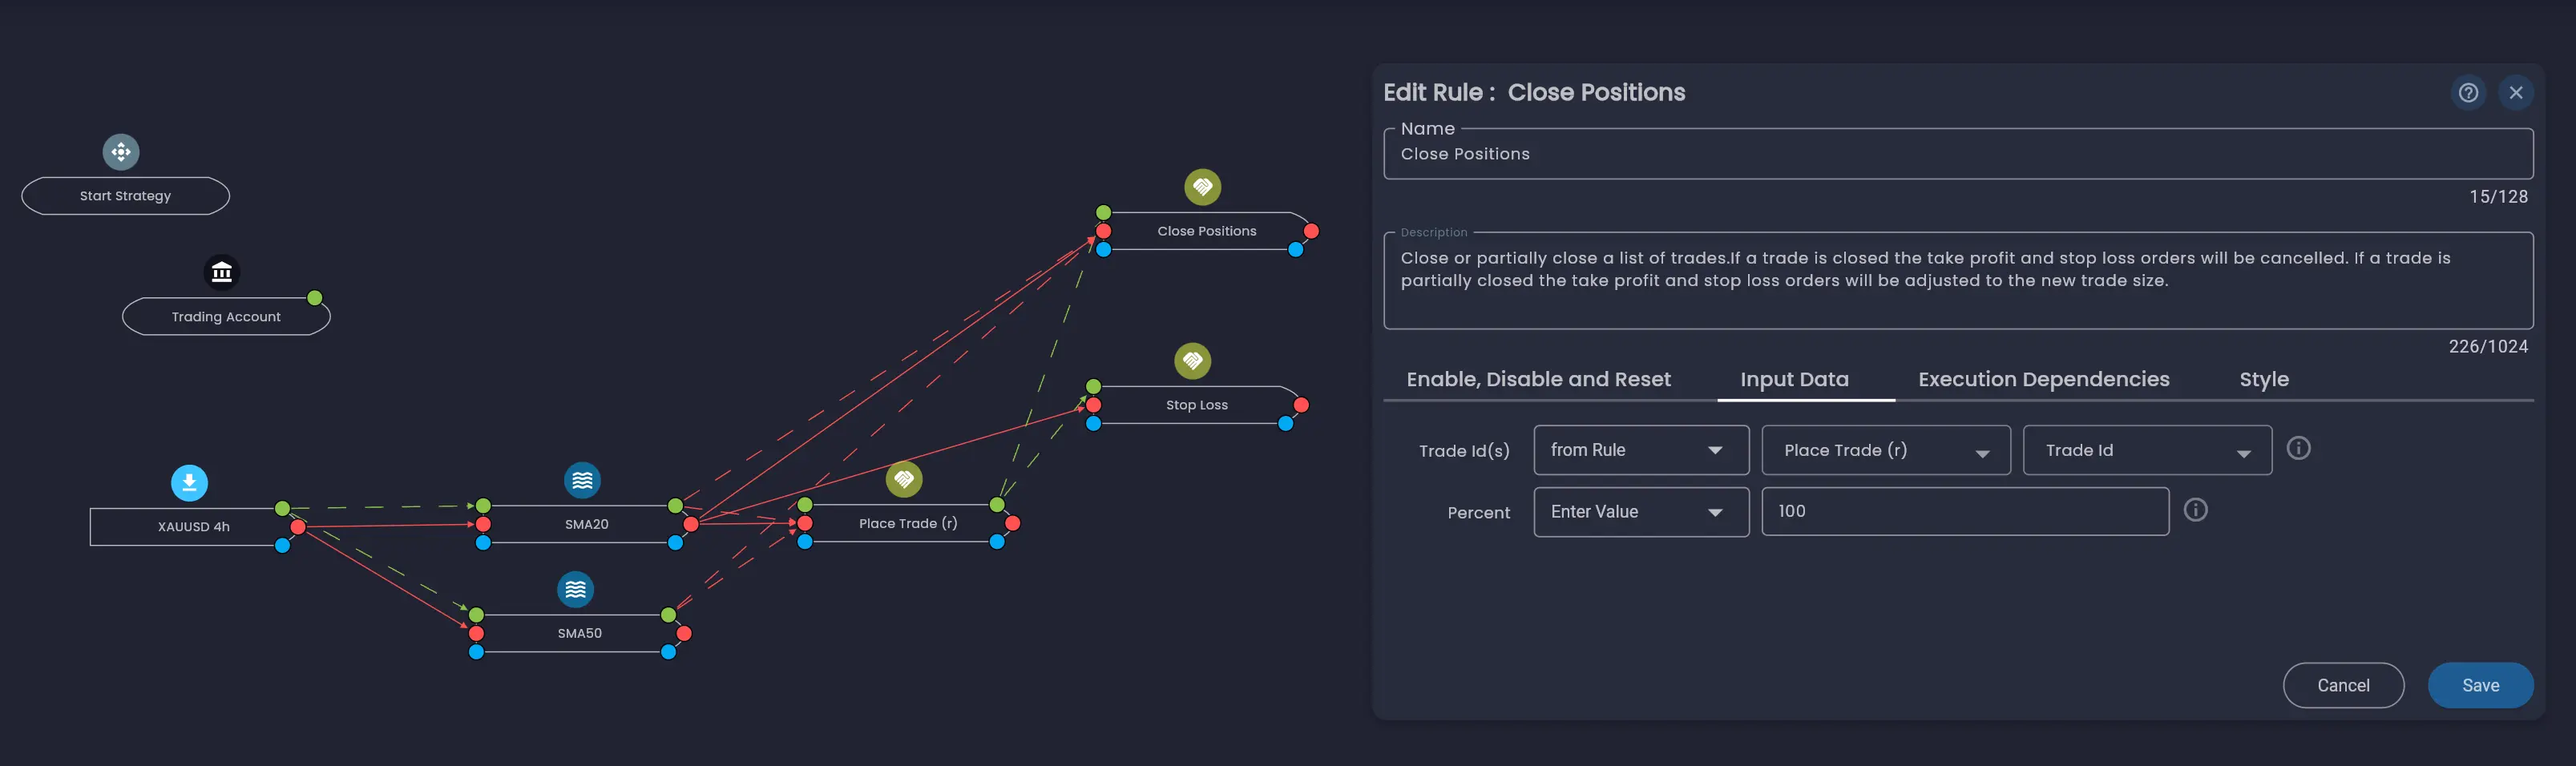
Input Data
Configure the Input Data tab:
- Trade Id(s) — Set to "from Rule", then select
Place Trade (r)andTrade Id. This tells the rule which trade to close. - Percent — Leave at
100to close the full position. You can set a lower percentage to partially close a position for more advanced strategies.
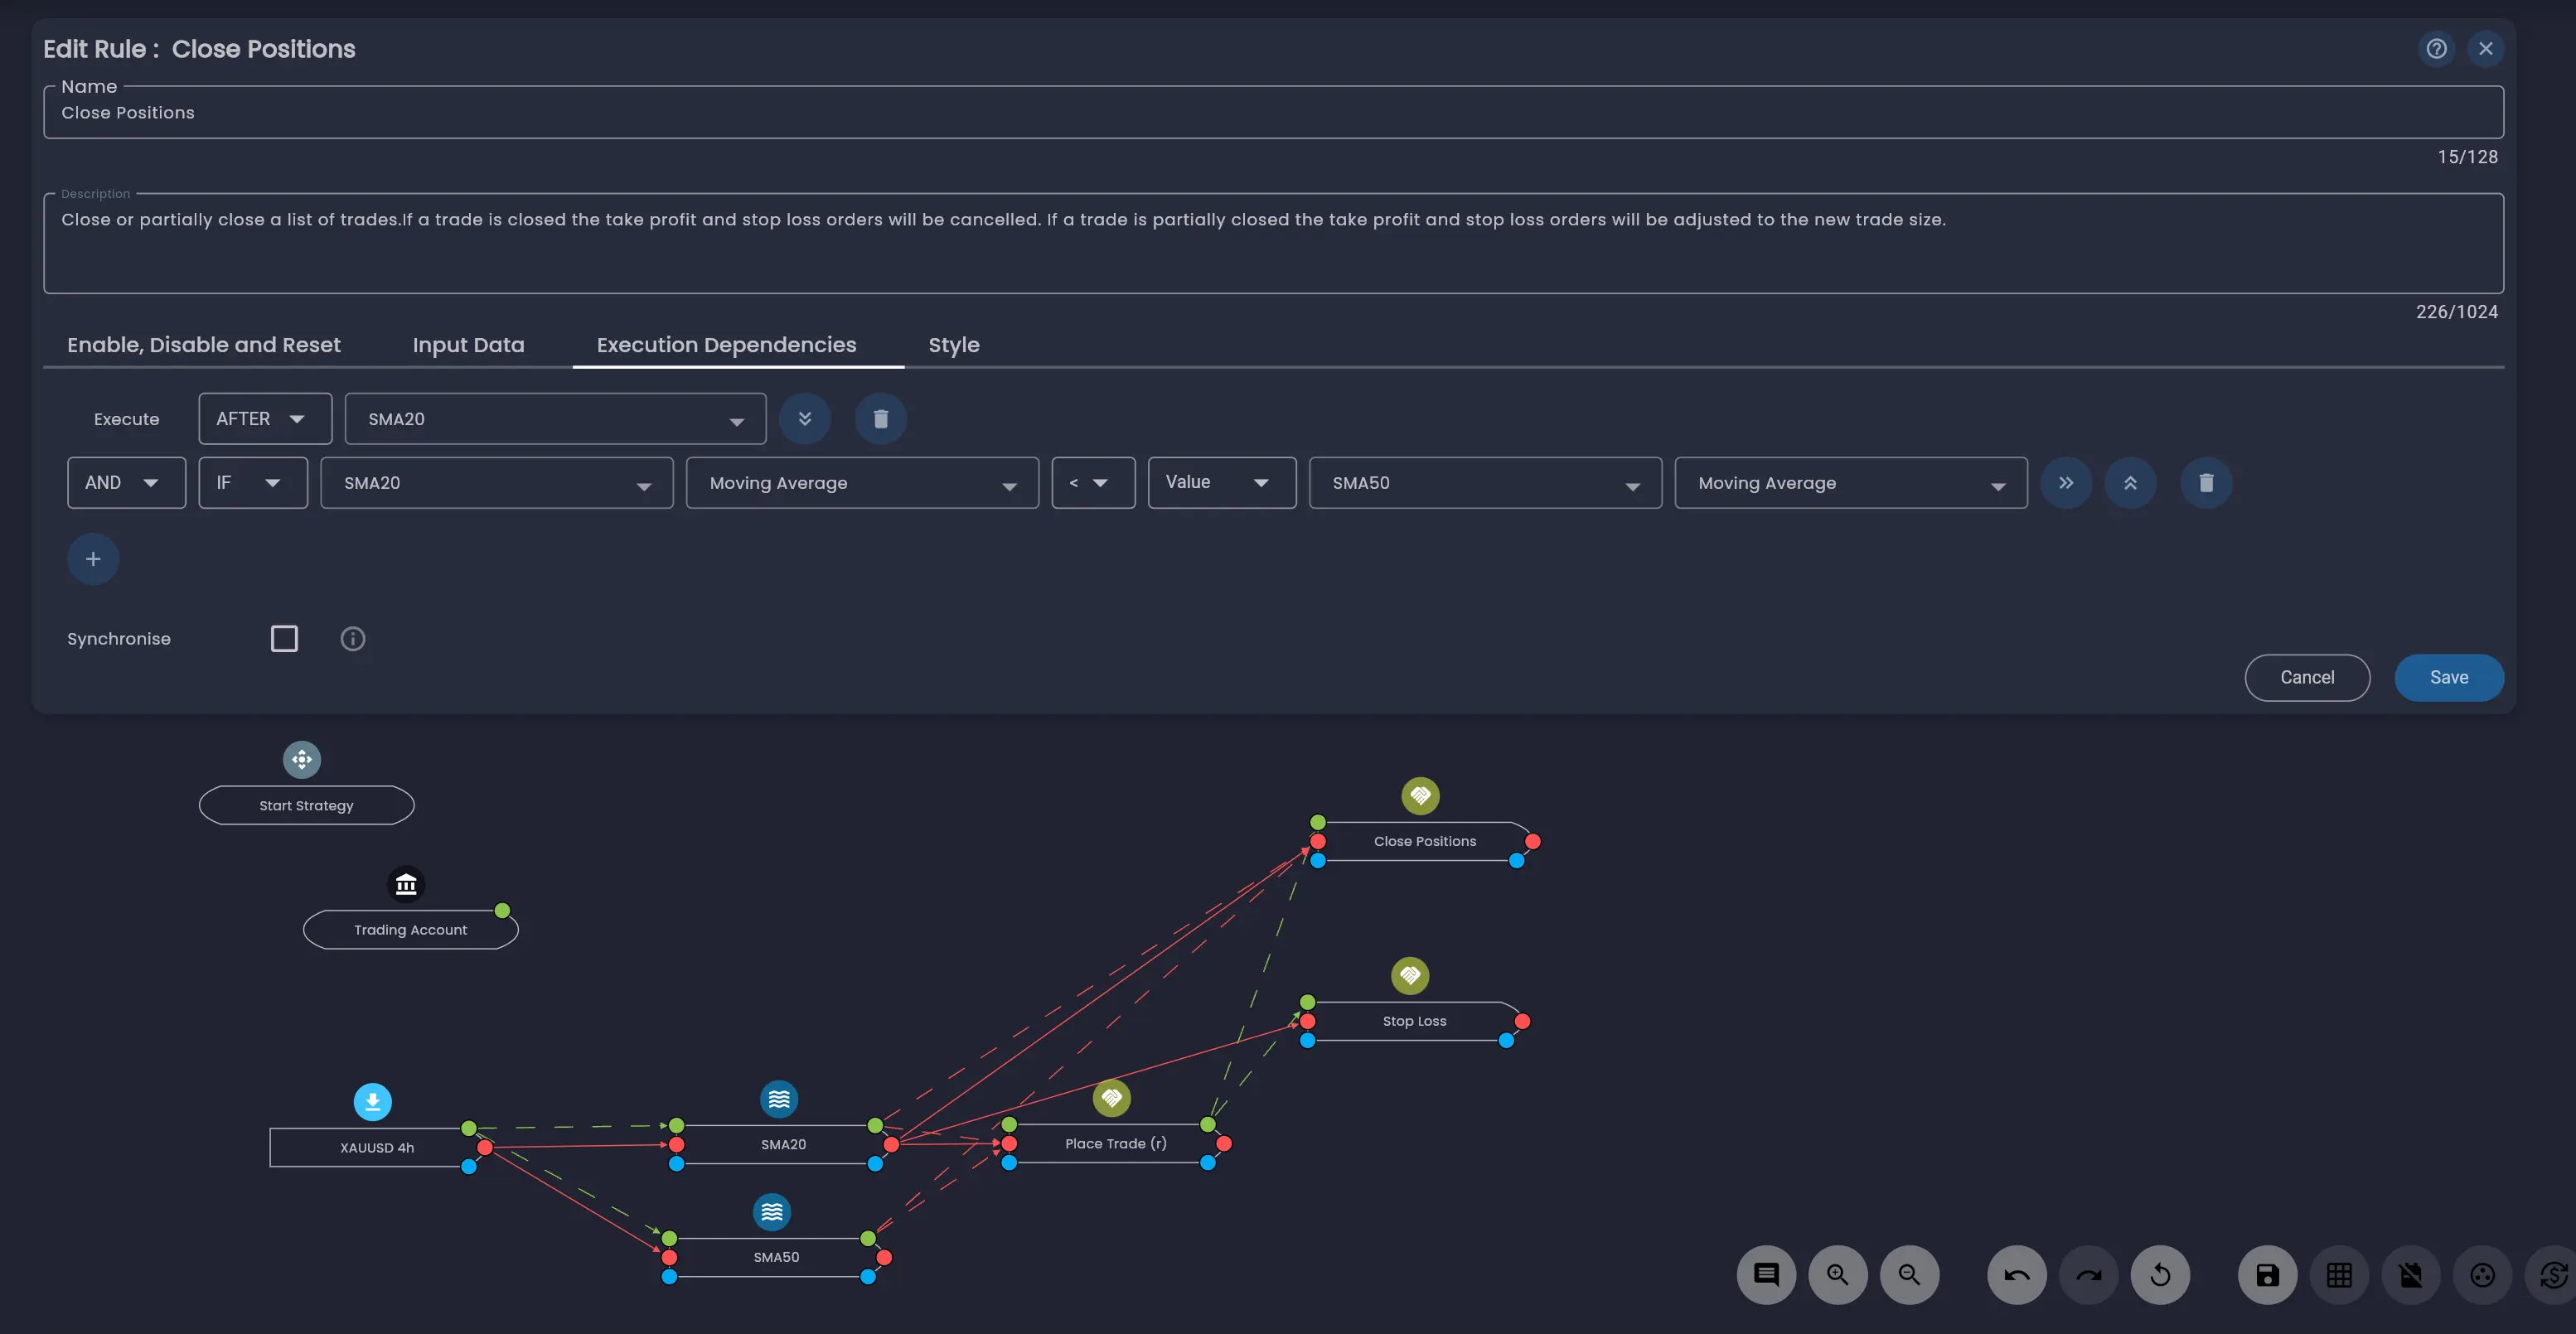
Execution Dependencies
Switch to the Execution Dependencies tab and set up the exit condition — the mirror image of the entry logic:
- Execute — AFTER
SMA20. - Condition — AND IF
SMA20→ Moving Average < Value →SMA50→ Moving Average.
Disabled After Execution
Switch to the Enable, Disable and Reset tab: the Close Positions rule is disabled after execution by default. This will be an issue if the rule executes before a trade is placed because the SMA20 is below the SMA50. In this case the rule will never execute again. To fix this, we change the configuration to Enabled After Execution.
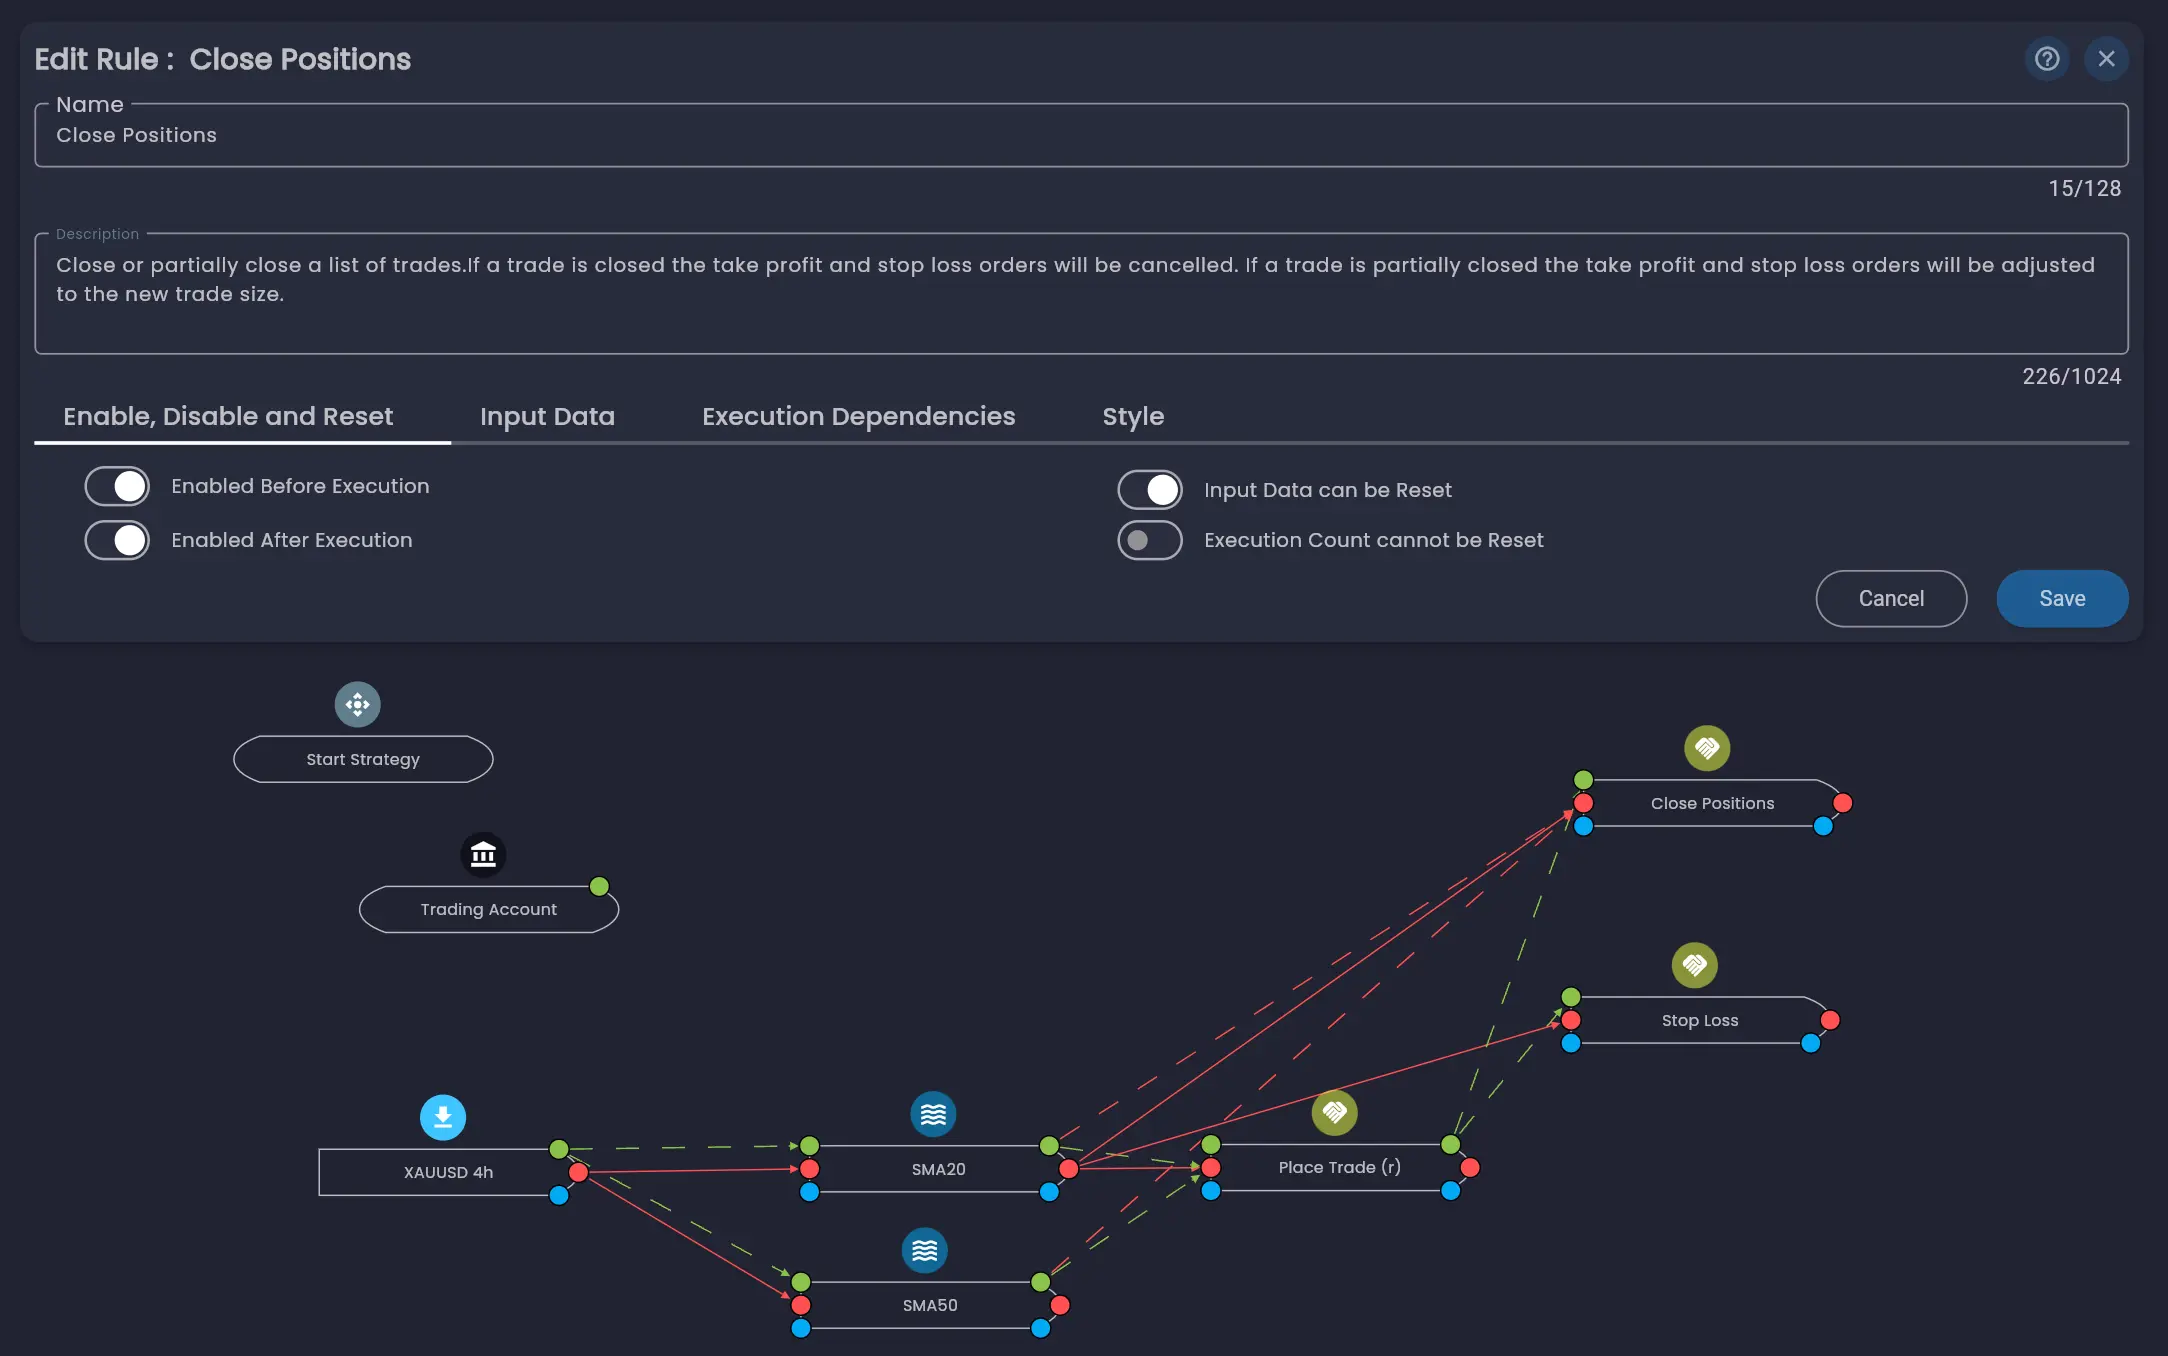
Click Save.
Review Your Strategy
Your strategy is now complete. The canvas should show the following rules connected together:
- Start Strategy — deploys the strategy immediately.
- Trading Account — defines the broker account and risk boundaries.
- XAUUSD 4h (Price Data) — provides 4-hour candle data for XAUUSD.
- SMA20 (Moving Average) — calculates the 20-period simple moving average.
- SMA50 (Moving Average) — calculates the 50-period simple moving average.
- Place Trade (r) — opens a buy position when SMA20 > SMA50.
- Stop Loss — protects the trade with a 15,000-pip stop loss.
- Close Positions — closes the position when SMA20 < SMA50.
Understanding the Canvas Links
The coloured lines connecting rules on the canvas represent different types of relationships:
- Red solid lines — Execution dependencies. These show which rule executes after another.
- Green dashed lines — Data dependencies. These show where a rule reads data from another rule.
- Blue dotted lines — Enable, disable or reset actions between rules.
You can show or hide the links for any specific rule by selecting the rule and using the option buttons, or toggle all links using the show/hide links button in the canvas toolbar.
Viewing Execution Order Priority
To understand the order in which rules will execute, click on any rule on the canvas. A red lightning bolt icon with a number will appear on each downstream rule, showing the execution priority. For example, clicking on the XAUUSD 4h rule will show the full execution chain: SMA20 (1) → SMA50 (2) → Place Trade (r) (3) → Close Positions (4) → Stop Loss (5). Where there are multiple rules that are both dependent on the same rule, the rule with the lower priority number will execute first.
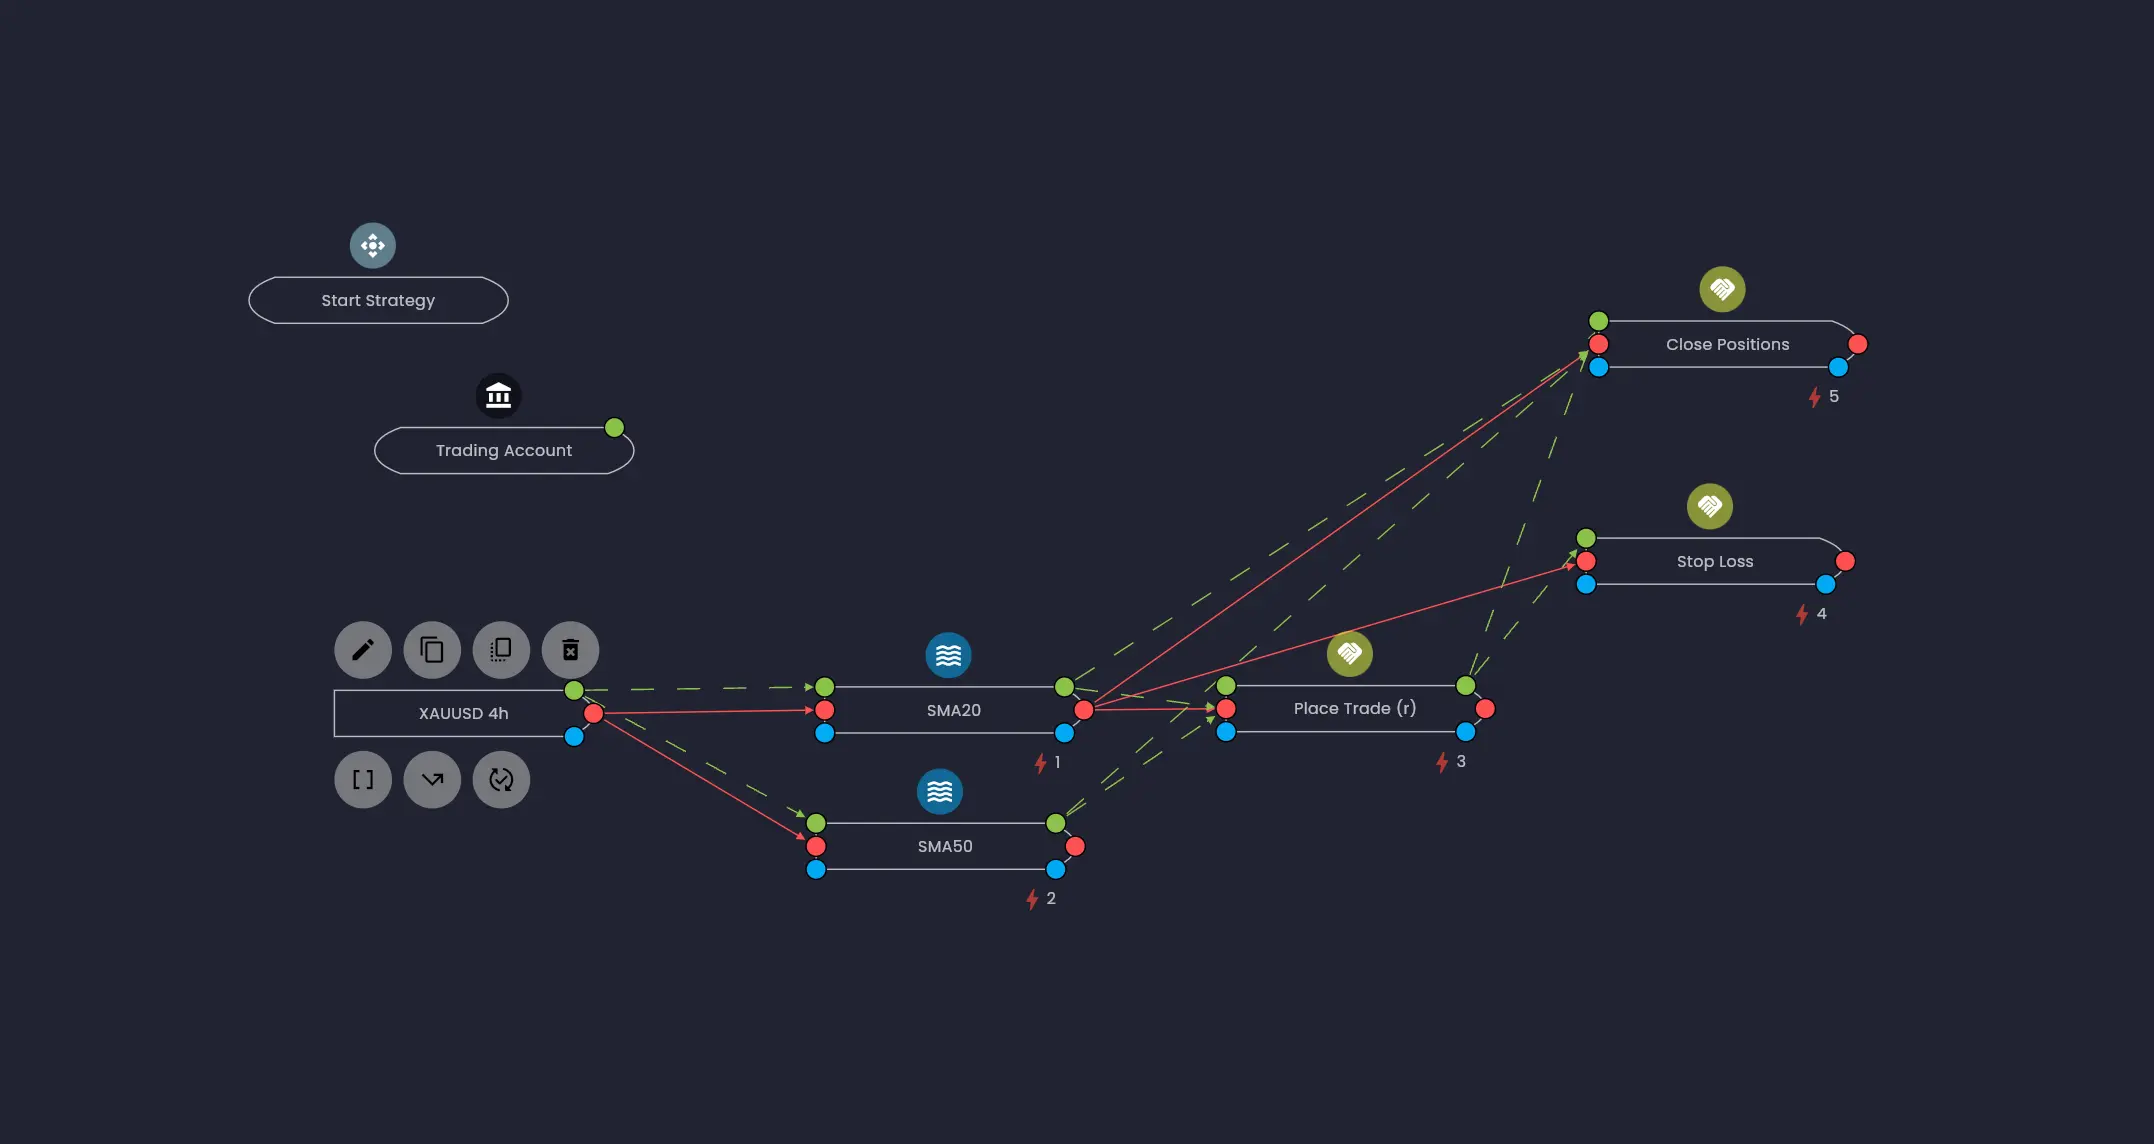
This visualisation is a powerful way to verify your strategy logic is wired up correctly. For more detail on execution order priority, see the Execution Dependencies documentation.
Saving and Versioning
Your strategy is saved automatically each time you save a rule in the Edit Rule dialog. Additionally, the canvas auto-saves every 30 seconds to capture changes such as moving rules around. Each change increments the minor version number (e.g. v1.1, v1.2, v1.3). The major version number increments when a strategy is deployed for a backtest or live trading.
Understanding the Logic Flow
It is worth taking a moment to understand how Arconomy evaluates your strategy during a backtest or live execution:
- Every 4 hours, the Price Data rule receives a new candle for XAUUSD. This triggers the execution chain.
- SMA20 and SMA50 are calculated from the latest price data.
- If no position is open and SMA20 is greater than SMA50, the Place Trade (r) rule opens a buy position at market price. The Stop Loss rule then immediately places a stop loss 15,000 pips below the entry.
- While a position is open, the Close Positions rule will be evaluated each time the SMA20, and the SMA20 rule will execute every time the XAUSUD 4h price data rule executes. If SMA20 drops below SMA50, the position is closed via the Close Positions rule. If the price falls $150 before that happens, the stop loss that has been placed will close the position first.
- Only one trade will be placed by this strategy as the Place Trade (r) rule is disabled after execution.
- In order to place another trade, the Place Trade (r) rule and the Close Positions rule would need to be enabled again.
- This can be done using a combination of the Trade Monitor rule and a Reset rule.
Next Steps
Your strategy is built and ready to test. Head to the next section to learn how to configure and run your first backtest against historical data.
Start simple and iterate. You can always come back to this strategy and add more rules, adjust parameters or refine the logic after reviewing your backtest results.
Was this helpful? Let us know