Platform Overview
This section provides a guided tour of the Arconomy platform. By the end, you will know where to find every major feature and understand how the different areas of the interface work together.
Navigation
The Arconomy platform uses a primary navigation bar along the left side of the screen. This sidebar is always visible and provides one-click access to every major section of the application. The navigation is organised into the following areas:
- Dashboard — Your home screen view of deployed strategies and activity overview.
- Build Strategy — The list of strategies you have built.
- Manage Portfolio — The list of portfolios you have created.
- Backtest Results — The list of backtest results.
- Strategy Results — The list of deployed strategy results.
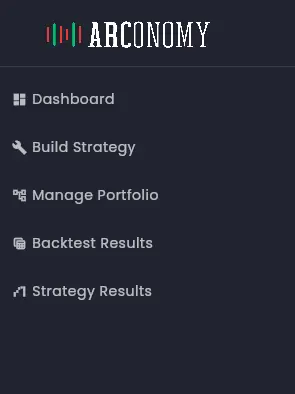
You can collapse the navigation sidebar by clicking the toggle at the bottom to give yourself more workspace when building strategies on the canvas.
Dashboard
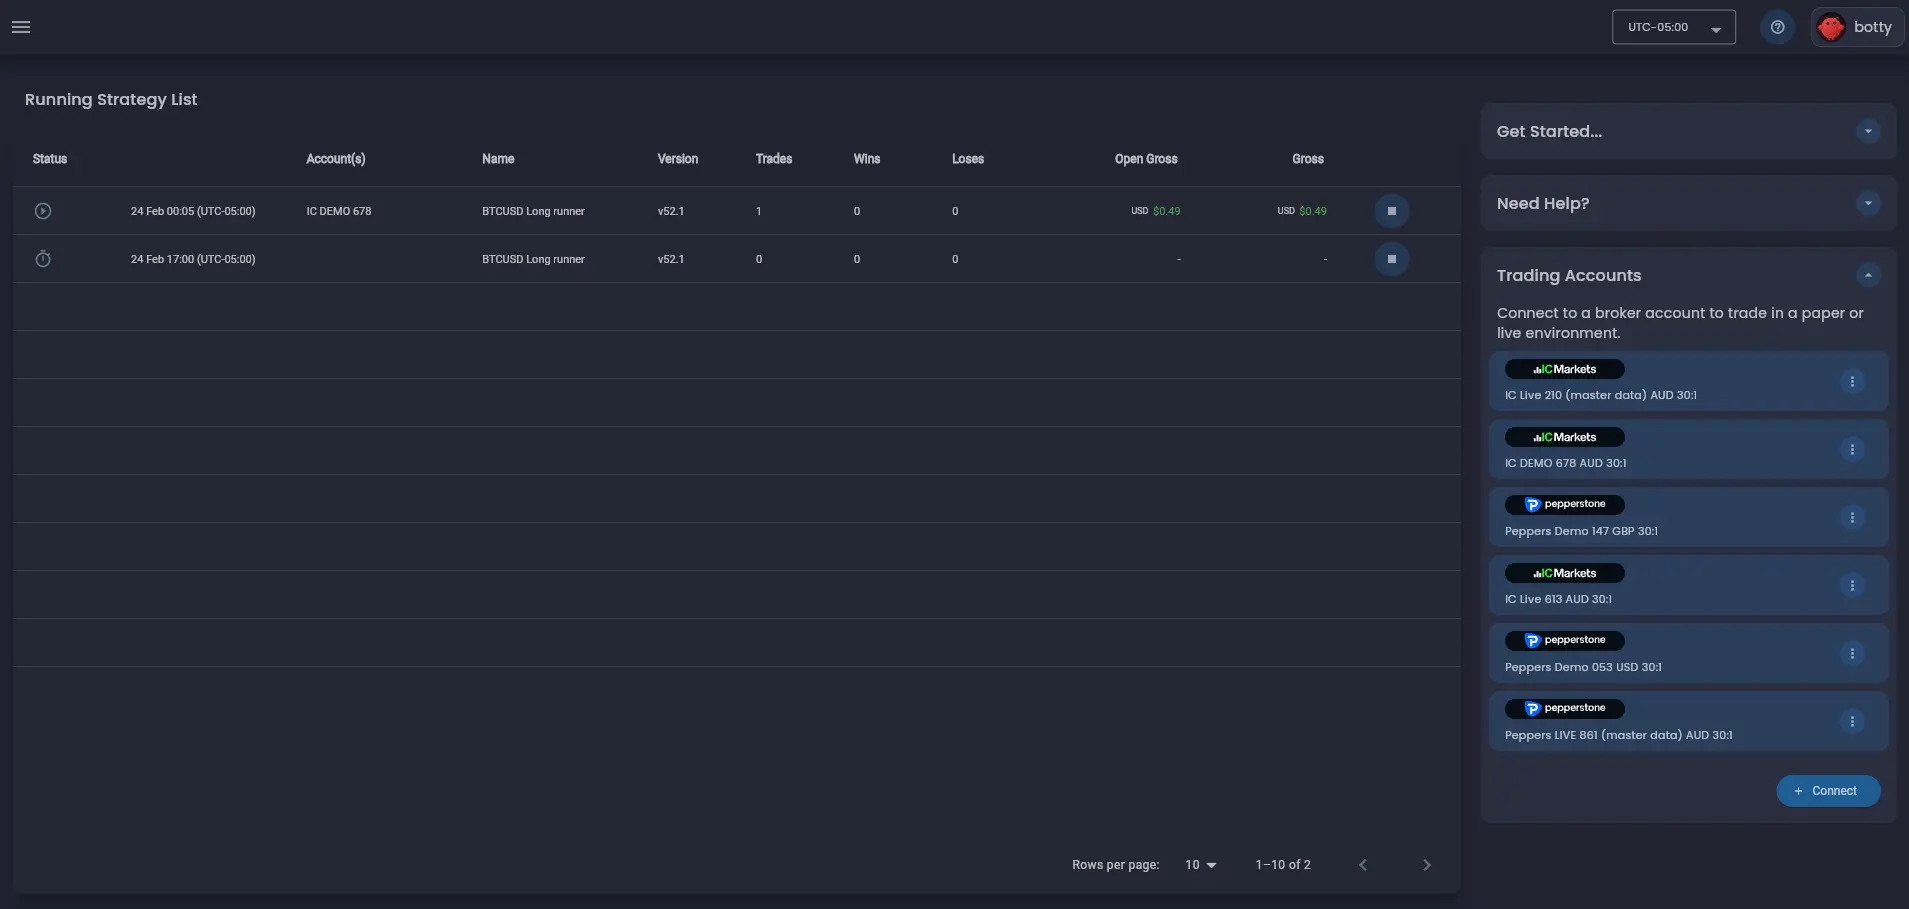
The dashboard is the first screen you see after logging in. It serves as your command centre, providing a summary of your running strategies and account status.
Deployed Strategy Table
Each deployed strategy appears as a row in the deployed strategy table on the dashboard. The table displays the strategy name, the account the strategy is deployed to, its current status (scheduled or running), and a summary of key performance metrics such as profit, wins and losses.
Trading Accounts
The trading accounts card shows a list of all your connected brokerage accounts. For each account, it displays the account name, the account type (demo or live), the account currency and the account leverage. You can also see the account status (connected or disconnected) and the date the account was connected.
Build Strategy
The build strategy section is where you can create and manage your trading strategies. It is divided into two main areas: the strategy list and the strategy builder.
Strategy Designer
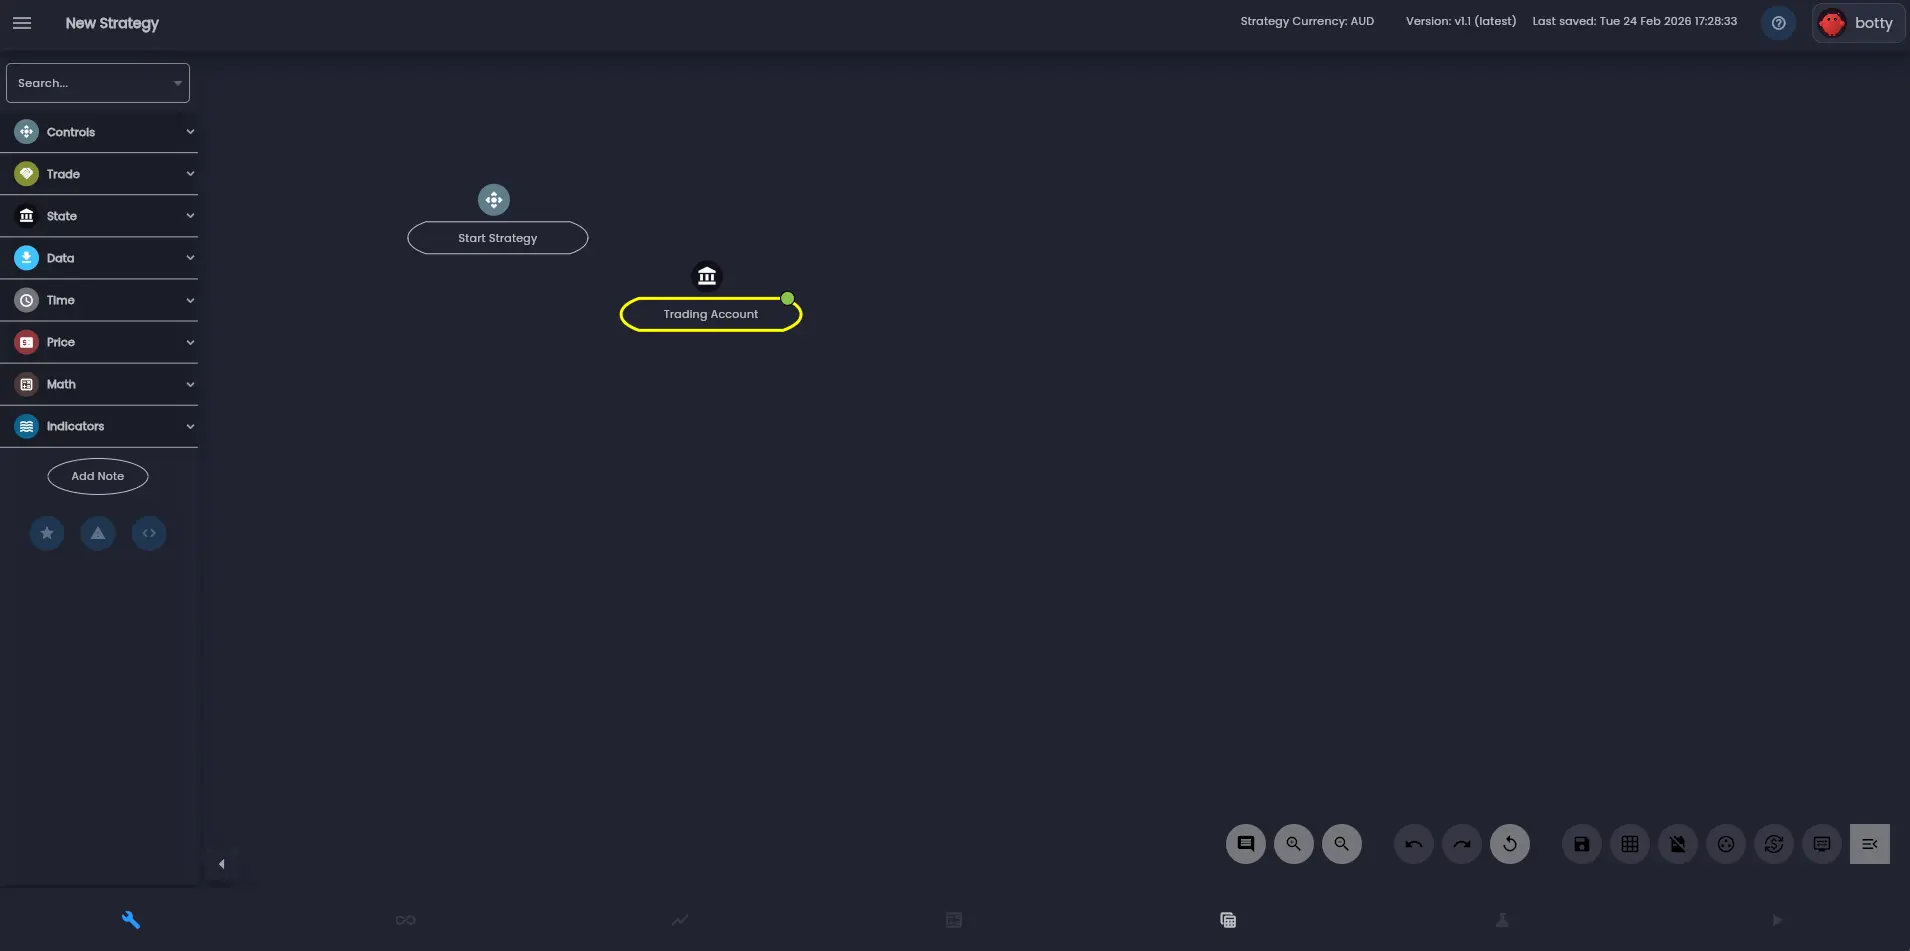
The Strategy Designer is where you spend most of your time designing trading logic. It is built around a visual canvas that lets you assemble strategies by dragging, dropping, and connecting rule shapes. You can pan around the infinite canvas by clicking and dragging the background, and zoom in or out using your scroll wheel or the zoom controls in the bottom-right corner.
Rules Menu
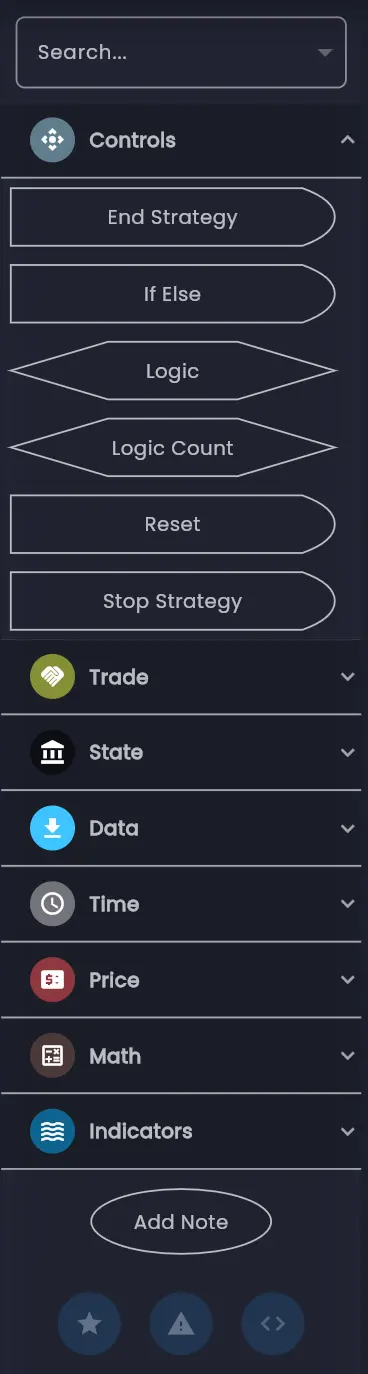
On the left side of the Strategy Designer, the rules menu provides access to the full rules library. Rules are organised into categories — Controls, Trade, State, Data, Time, Price, Math and Indicators. You can browse categories or search by rule name. To add a rule to your strategy, drag it from the panel onto the canvas.
Configure a Rule
When you select a rule on the canvas a list of options are displayed. The options on the top of the rule allow you to edit, copy, create a shadow copy or delete the rule. The edit option opens a configuration dialog for the rule. The copy option creates a copy of the rule on the canvas. The shadow option creates a shadow copy of the rule on the canvas - this can be used to simplify visualising a strategy as the shadow rule can then be used in another part of the strategy without the need to create duplicate of the original rule or lots of links to the original rule. The delete option removes the rule.
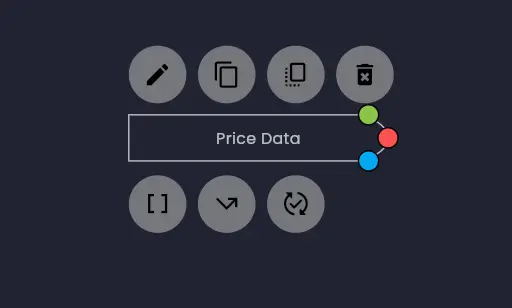
The options on the bottom of the rule allow you to hide or show the links to other rules. This can be useful when analysing a rule and the relationships with other rules in the strategy. There are three types of links as follows: execution links, data dependency links and enable,disable and reset links.
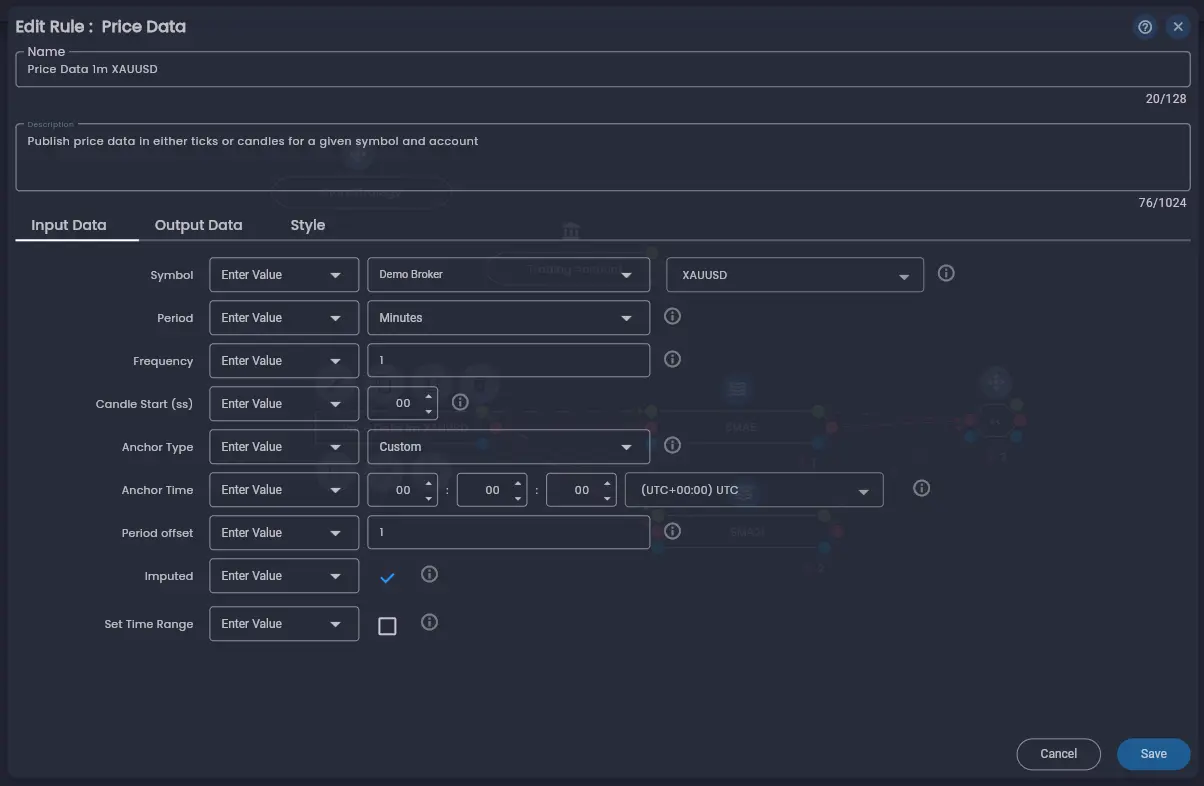
Rules Editor Dialog
After clicking the edit rule option the rules editor dialog is displayed. The rules editor dialog allows you to configure the parameters of a rule. This dialog shows all of the rule's configuration parameters — in the Price Data rule below there are basic configuration parameters for the period, frequency of the data required and other more advanced configurations to customise the candle data that the rule will generate. By clicking the information icon next to each configuration feild a description of the parameter is provided by the Arconomy trader assistant AI.
Tips
Here are a few tips to help you work efficiently in the Arconomy Strategy Designer:
- Designer Controls — Use the control buttons at the bottom right of the canvas to zoom in and out, undo, redo, reset and save the strategy. There are also a number of other buttons to show/hide links, symbol and currency details for all the rules.
- Multi-select — Press, hold and drag to select multiple rules or use the multi-select control on the bottom right of the canvas.
- Multiple tabs — You can open multiple strategies in separate browser tabs to compare them side by side.
- Auto-save — The Strategy Designer auto-saves your work every 30 seconds, so you will not lose progress if your browser closes unexpectedly.
- Responsive layout — The platform adapts to different screen sizes, but for the best experience with the Strategy Designer canvas, we recommend a screen width of at least 1280 pixels.
Backtesting
The Backtesting section is where you test your strategies against historical market data. The Arconomy Backtest engine provides high performance event-driven execution configured through a simple interface.
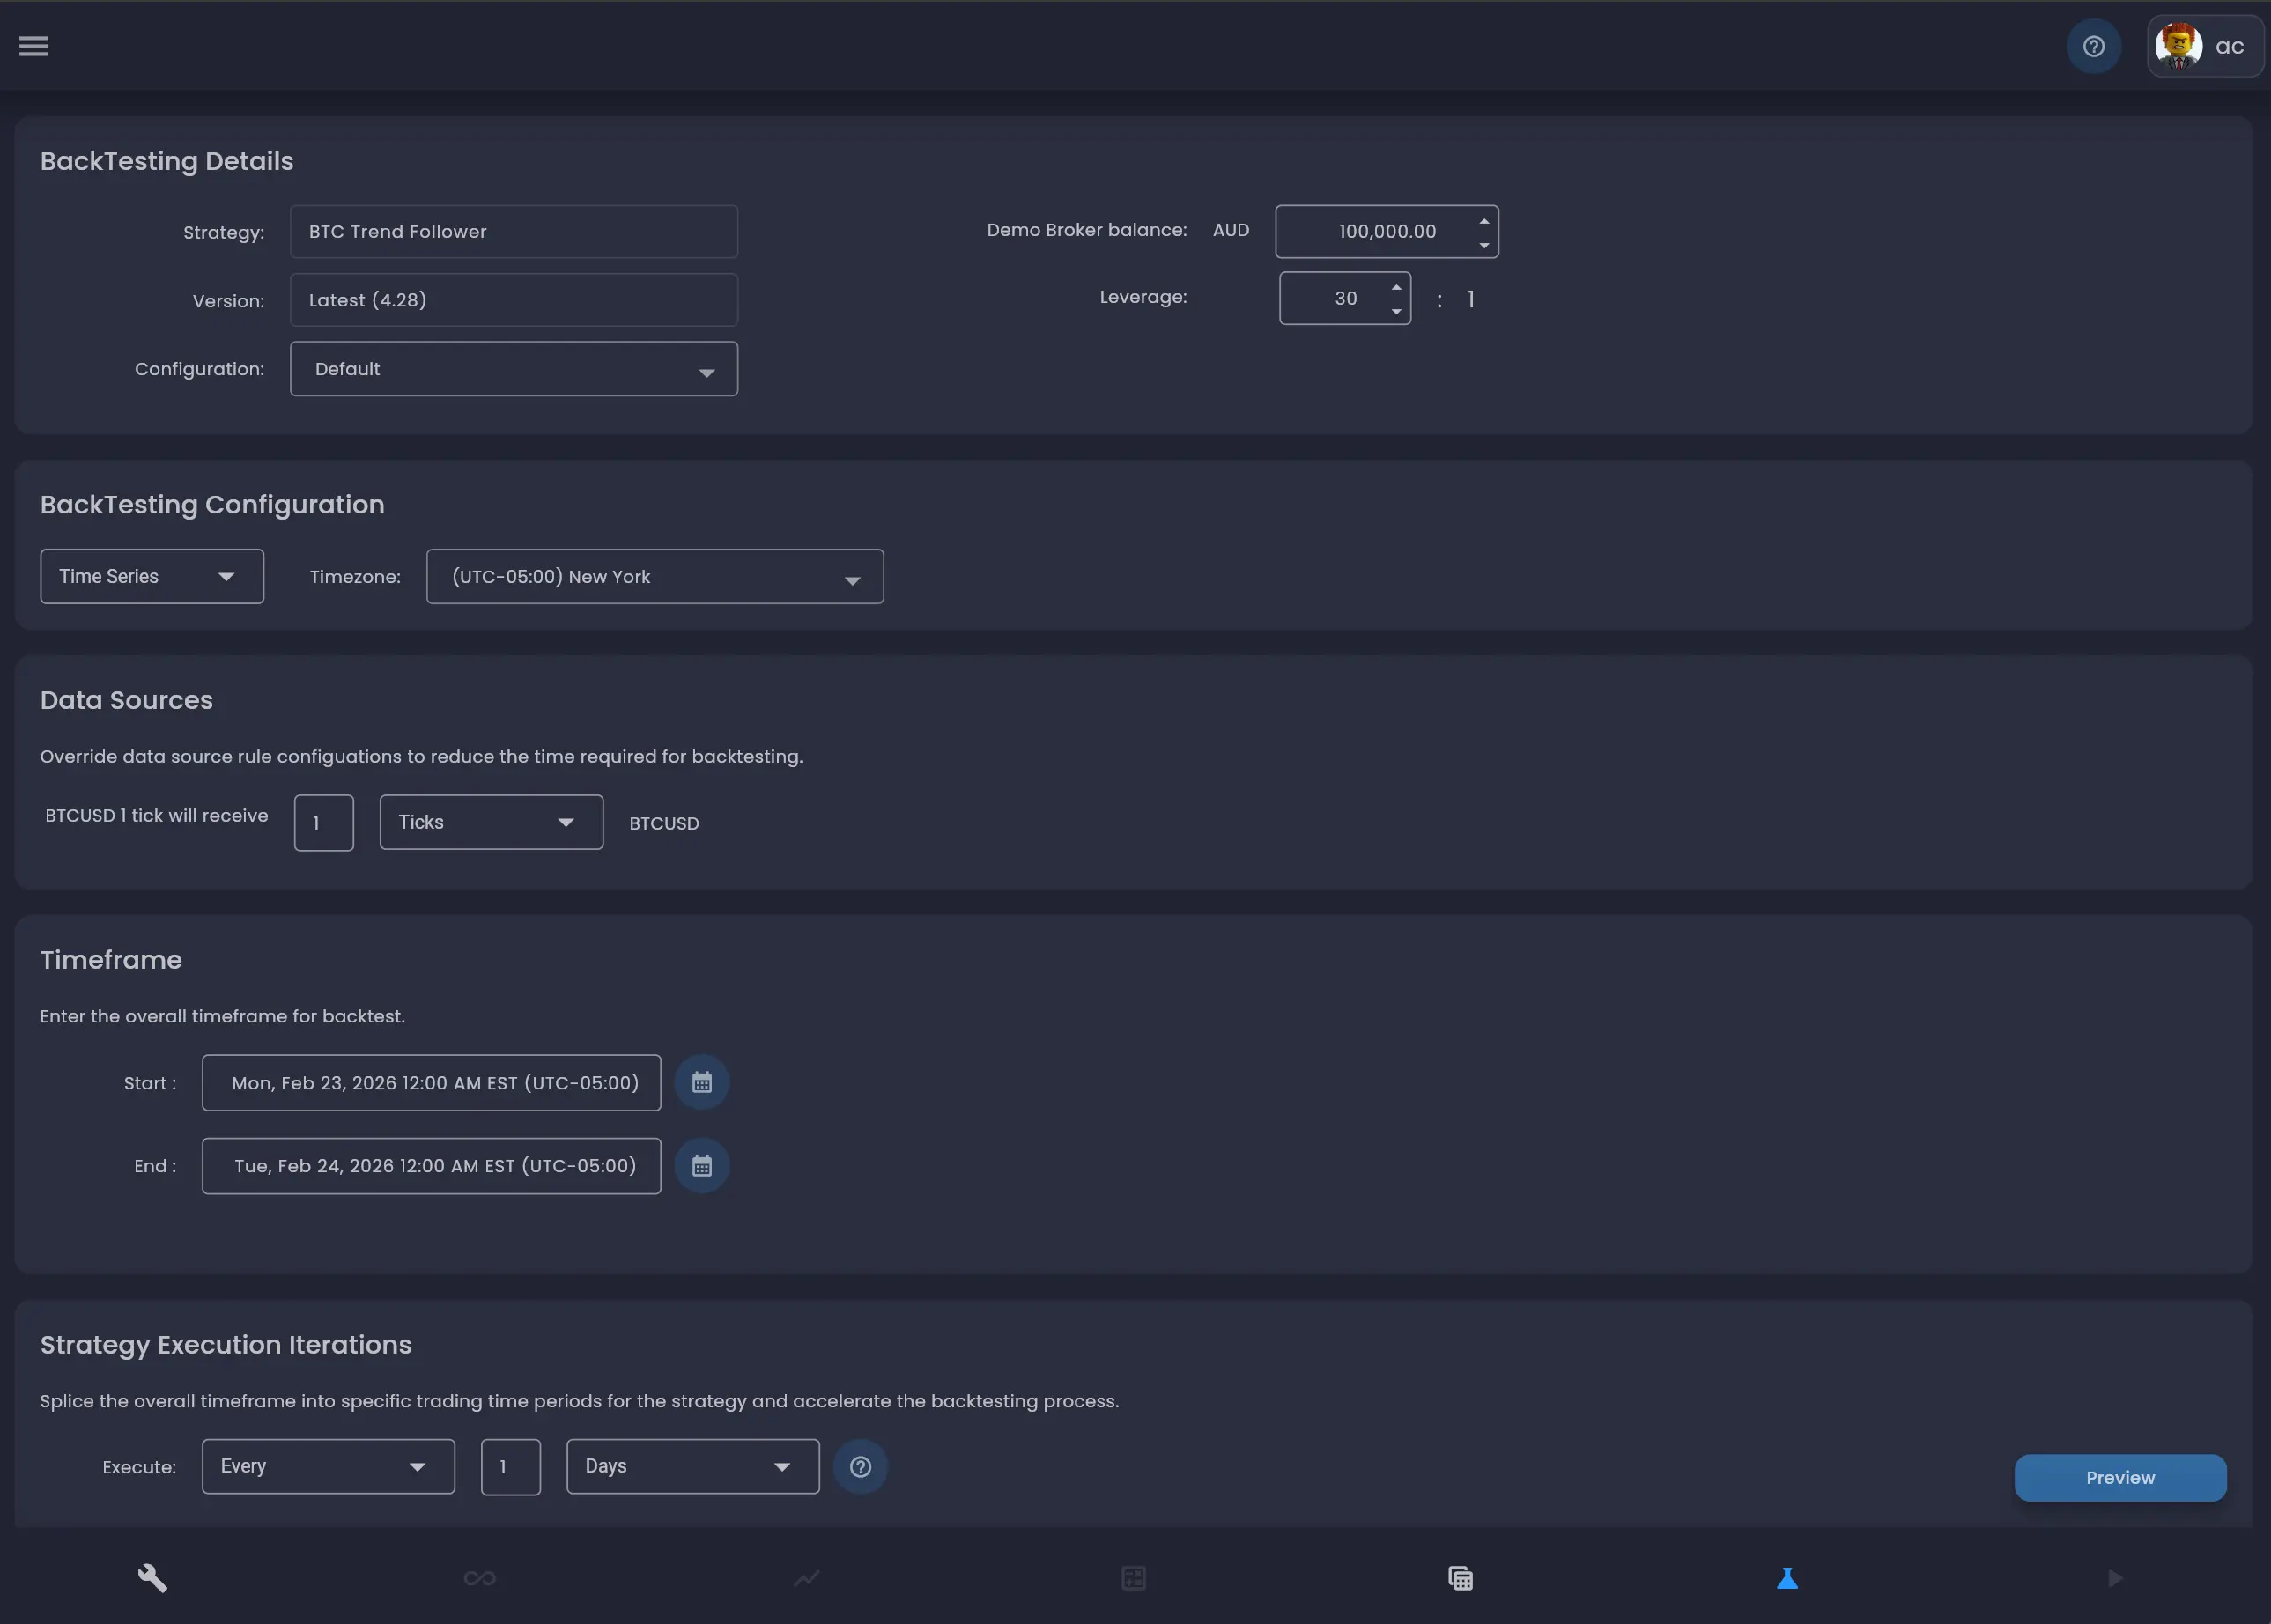
Backtest Configuration
Before running a backtest, you configure several parameters:
- Strategy — Select which strategy to test from your saved strategies.
- Account — Set the initial account balance and account leverage for the simulation.
- Date range — Choose the overall historical period to simulate, from a few hours to several years.
- Iteration Configuration — Choose whether to run a strategy as single iteration or splice the date range into smaller time chunks for faster execution iterations and align to your target trading hours for the strategy.
- Analysis options — Choose the level of analysis detail to capture from the simulation. Event level (full), time-based, trade-based or final state only.
Execution Progress
Once you launch a backtest, a progress indicator shows the number of iterations running and completed of the strategy. You can see the current duration of a backtest - no single backtest iteration should take longer than ~5 minutes. Backtests run on Arconomy's cloud infrastructure, so you can navigate to other parts of the platform while the backtest completes.
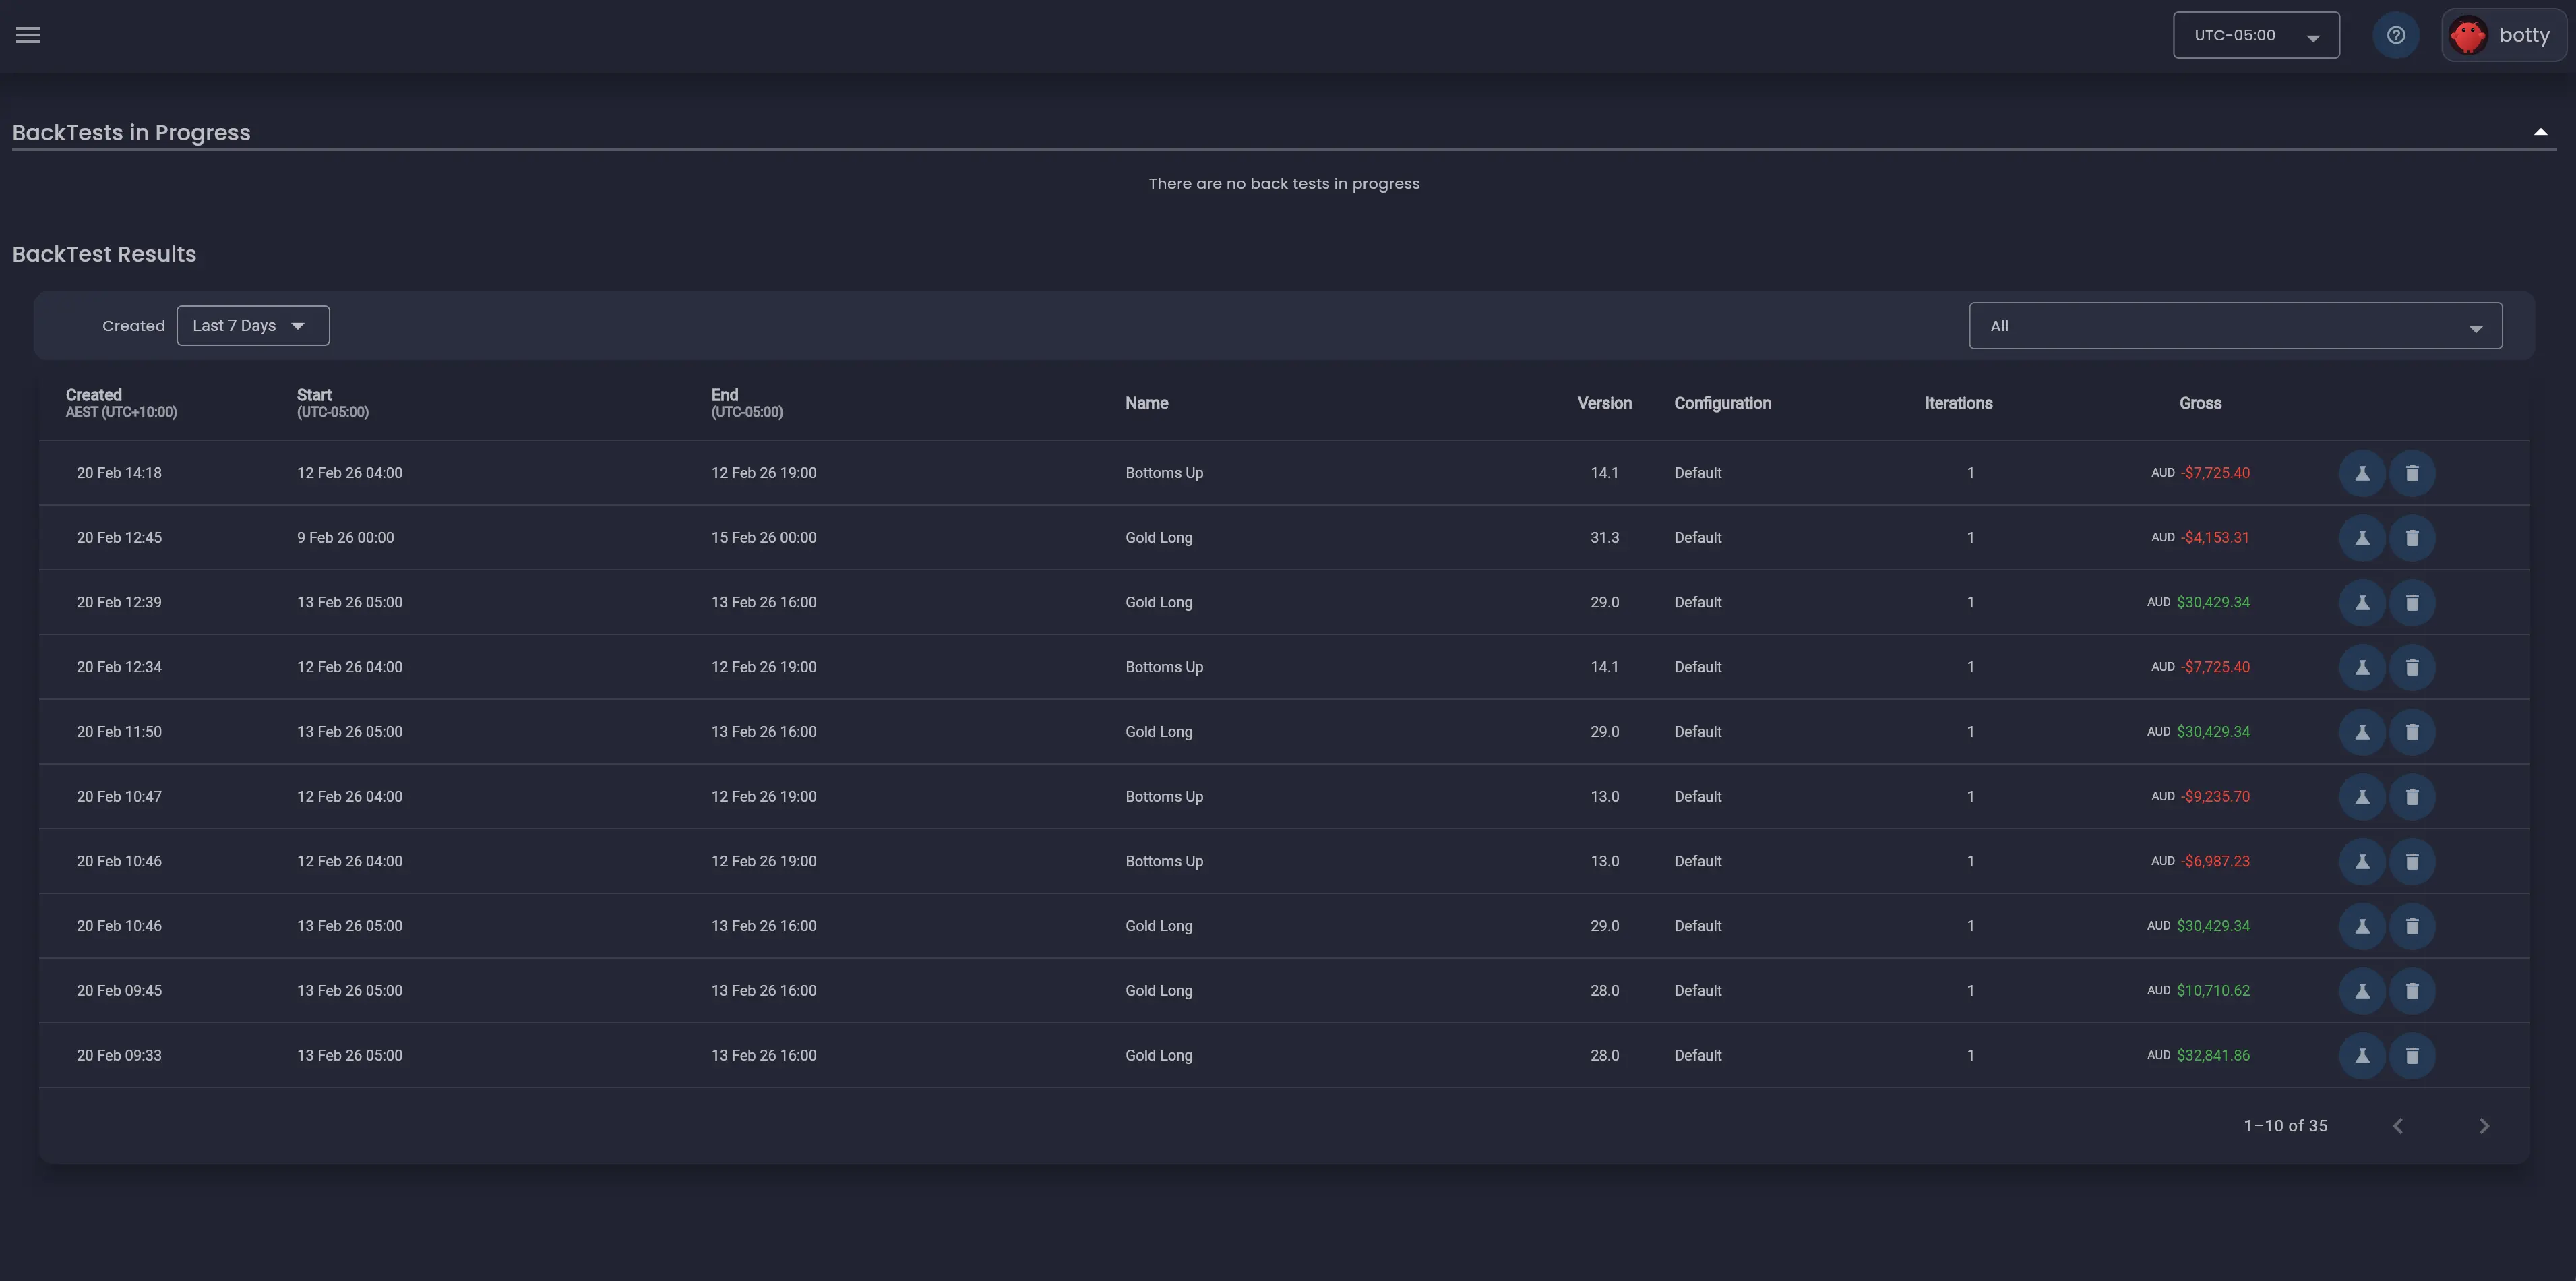
Backtest Results
When the backtest finishes, the backtest will display in the backtest results list. Clicking on a result in the list will open the backtest summary results screen where you can view the summary statistics (net profit, total return, max drawdown, Sharpe ratio, win rate) for the backtest and the results of each iteration within the backtest. You can export the results as a trade results as a CSV file for further analysis.
Strategy Analysis
Drilling down further into a specific iteration of a backtest, you can view the strategy result screen where you can view the results and metrics for single iteration in the backtest. From the strategy result screen you can navigate to the strategy designer screen in "Analysis Mode" which provides deep inspection tools that go beyond the summary metrics of a backtest. This is where you understand why your strategy made specific decisions.
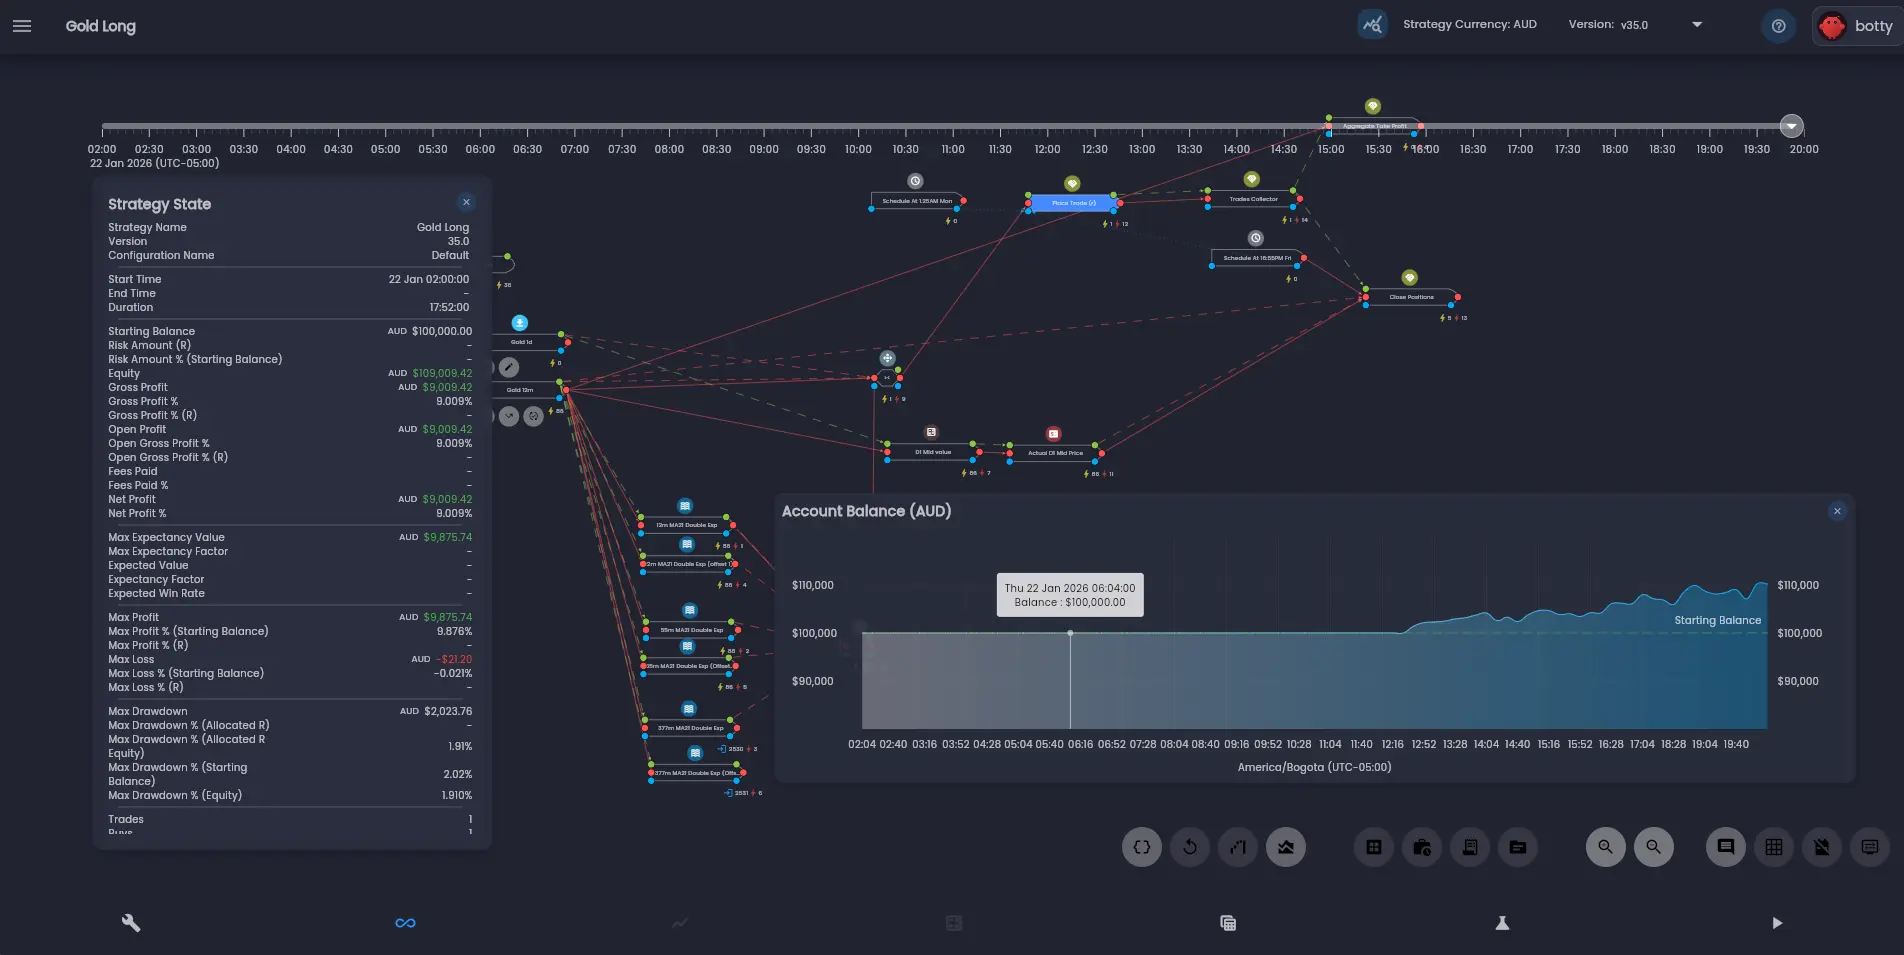
The Analysis Screen
The analysis screen presents the strategy canvas with execution data overlaid. Each rule displays a lightning bolt icon with a count showing how many times it executed. You can inspect the internal state of any rule, view the strategy state data, and review trades directly on the price chart.
Timeline and Playback
When a backtest is run with a higher fidelity analysis mode, the analysis screen gains a time slider and playback controls that let you step through the strategy execution over time. The price chart, rule states, and trade data all synchronise as you navigate the timeline.
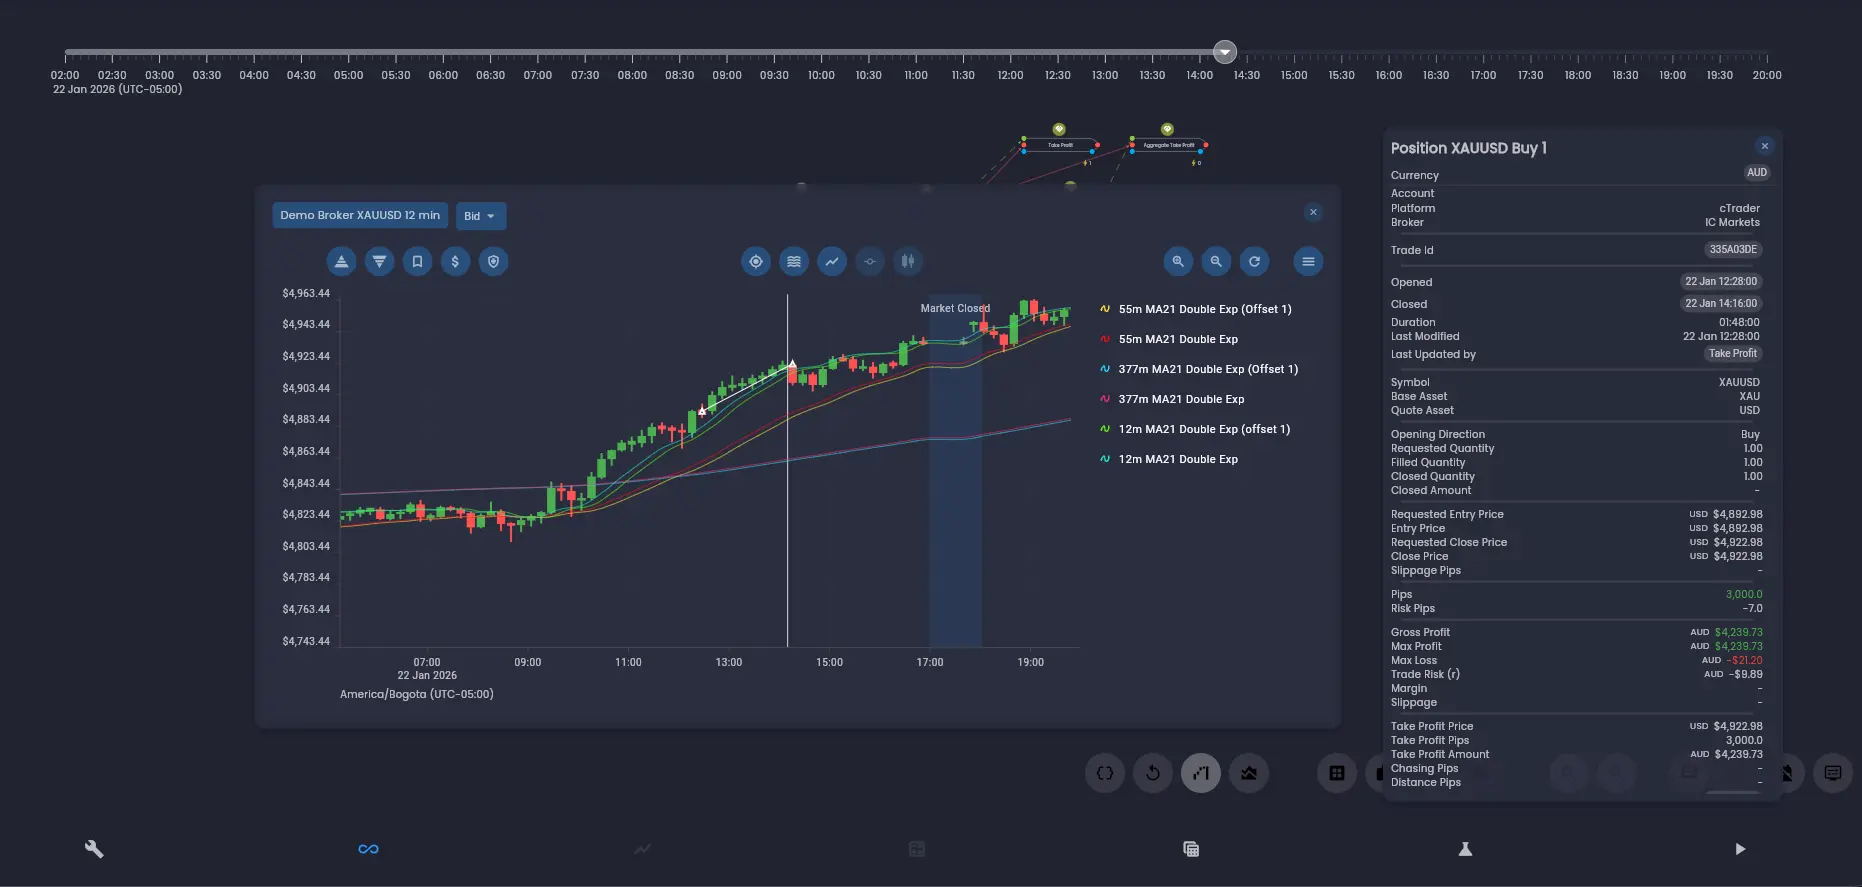
Inspecting Rules and Trades
The inspection tools let you examine individual rules, including their execution history, internal data, and execution dependencies. You can also view the trade list, trade details, trade logs, and data source values at any point in the strategy execution.
Broker Connections
The Broker Connections section lets you link your brokerage accounts to Arconomy for live or demo trading. Arconomy supports multiple brokers and account types.
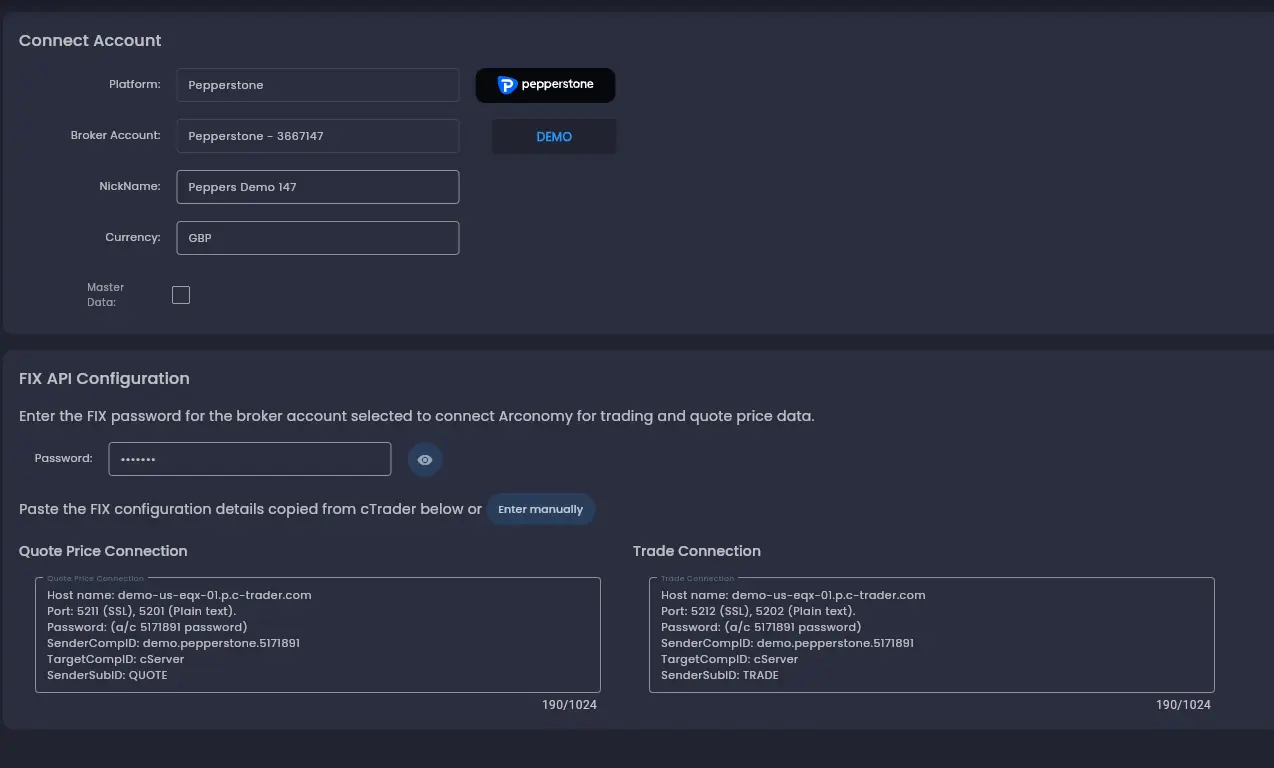
Connecting a Broker
To connect a broker, select your broker from the list of supported providers, then follow the authentication flow to log into your cTrader account. Arconomy currently integrates with brokers through the cTrader platform FIX API. After copying the FIX API credentials for your cTrader account and saving the connection, the broker account appears in your connections list with its status, account type (demo or live).
Account Management
You can trade with multiple broker accounts and symbols in a single strategy. Broker account connections are refreshed periodically and before deploying a strategy to verify the connection. You can disconnect accounts, refresh connection status, or switch between demo and live accounts.
We strongly recommend starting with a demo account to verify that your strategy executes as expected in a live environment before risking real capital. See Demo vs Live Accounts for more details.
Profile Settings
The profile Settings section lets you manage your Arconomy profile, subscription plan, billing information, and platform preferences.
Profile
Update your name, email address, and password. You can also configure notification preferences to control which email alerts you receive — for example, backtest completion notifications, deployment alerts, or billing reminders.
Plan and Billing
View your current subscription plan, usage limits, and billing history. Upgrade or downgrade your plan, update your payment method, or download invoices. See Plans & Pricing for detailed information about available plans.
Next Steps
Now that you are familiar with the platform layout, it is time to build something. The next section walks you through creating your first strategy from scratch using the Strategy Designer.
Was this helpful? Let us know