Analyse Rules and Trades
The analysis screen provides a set of inspection dialogs for examining the behaviour of individual rules, the lifecycle of trades, and the raw data feeding the strategy. Together, these tools provide deep visibility into every decision point made by your algorithm.
Rule State View
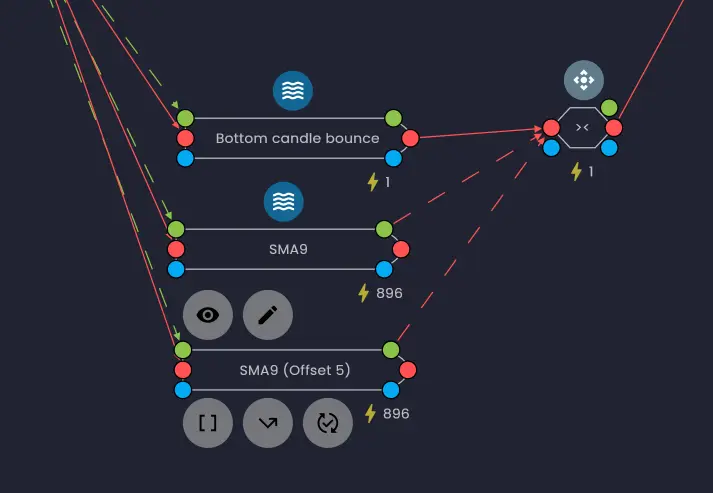
To inspect a specific rule, click on it in the strategy canvas. In addition to the editing options, you will see a View icon — clicking this opens the Rule State View.
The Rule State View is divided into four sections, each providing a different perspective on the rule's behaviour.
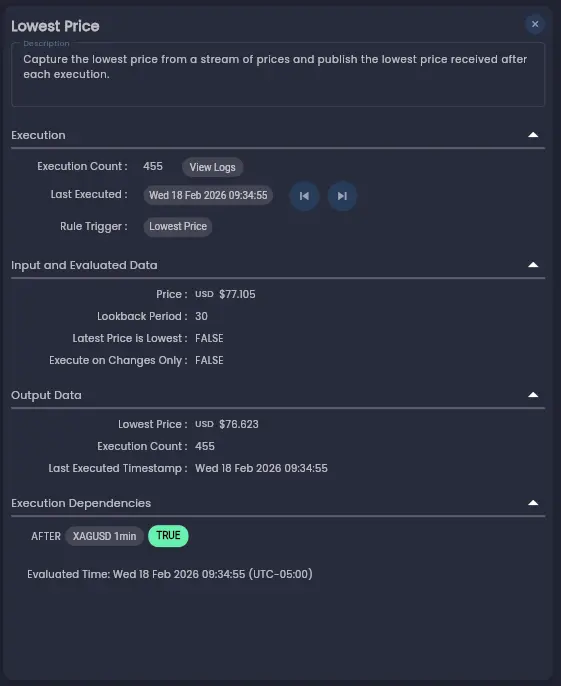
Execution
The Execution section provides an overview of the rule's activity:
- Execution count — How many times the rule fired during the strategy run.
- Last execution time — The timestamp of the most recent execution.
- Rule Trigger — Which rule triggered this rule's execution.
- Activation state changes — The last time the rule was enabled or disabled, and which rule caused the change.
When using a higher fidelity analysis mode, the Execution section also includes navigation buttons to jump to the Next Execution or Previous Execution in the timeline. The entire analysis interface synchronises to those moments, enabling cause-and-effect tracing for specific rule behaviour.
Input and Evaluated Data
The Input and Evaluated Data section displays the internal state of the rule: its inputs and computed values (meta-data) at the current point in the timeline (or at the end of the executed timeline when in final state mode). This shows you exactly what values the rule was working with.
Output Data
The Output Data section shows the output field values that were computed and output from the rule's most recent execution. If a rule updated trades or completed trade actions, the trade IDs that were affected are listed as clickable links, allowing you to jump directly to the trade details.
Execution Dependencies
The Execution Dependencies section outlines the logical conditions required for the rule to execute. Each condition statement also displays the logical result of the last evaluation, either true or false. There are links to source rules that passed data values to the expression to allow you to jump to a dependency for further analysis.
This is key for debugging complex logic chains where rule outputs feed into other rule execution dependencies. By examining the rule state at a specific moment in the timeline, you can trace exactly why a rule did or did not fire.
When investigating why a rule did not execute, navigate to the moment in the timeline where you expected it to fire and examine the Execution Dependencies section. The conditions shown as false will point you to the source rules that prevented execution.
Rule Logs
For in-depth analysis of a rule's behaviour over time, you can view the Rule Logs. The Rule Logs show each time a rule was executed throughout the strategy run, providing a chronological record of rule activity.
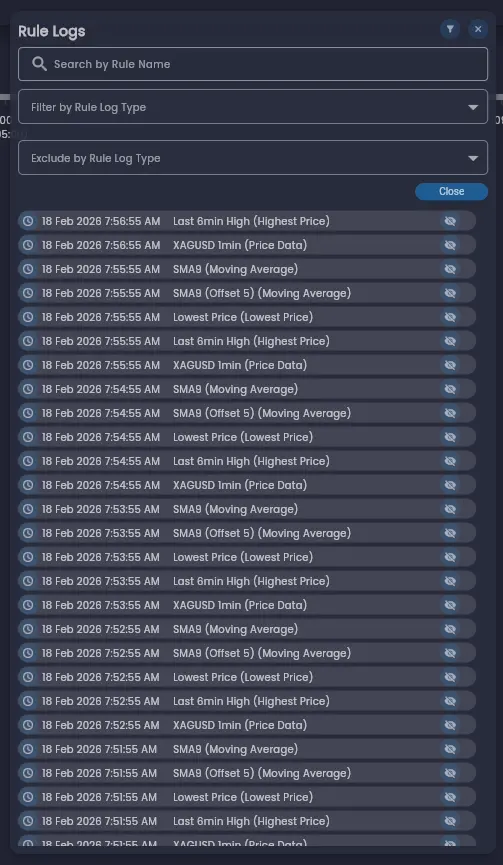
Rule logs can be:
- Filtered to a specific rule — Show only the executions of a particular rule to focus your investigation.
- Hidden for noisy rules — Exclude frequently executing rules from the list to reduce clutter and focus on the rules you are investigating.
Rule Logs are available when using a higher fidelity analysis mode (Full, Time-Based, or Trade-Level). In final state mode, only the summary execution count and last execution time are available in the Rule State View.
Trade List Dialog
Click the Show Trades button to open the Trade List dialog. This displays all trades generated by the strategy during execution.
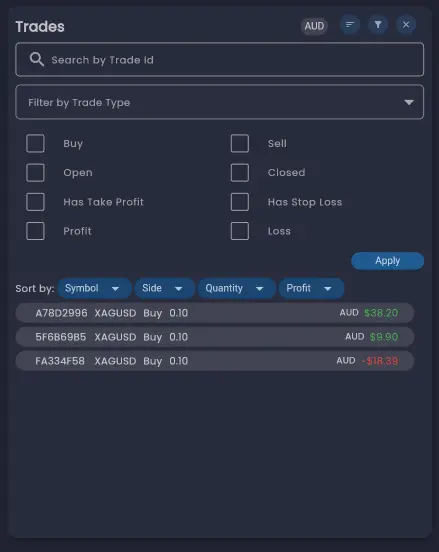
The Trade List dialog provides:
- Filter by type — Narrow the list to specific order types (such as market orders or limit orders).
- Filter by direction — Show only buy trades or sell trades.
- Sort — Reorder the list using the sort button to arrange trades by different criteria.
Double-click a trade in the list to open its full details in the Trade Details dialog.
Trade Details Dialog
The Trade Details dialog provides the complete information for an individual trade, including all entry and exit details.
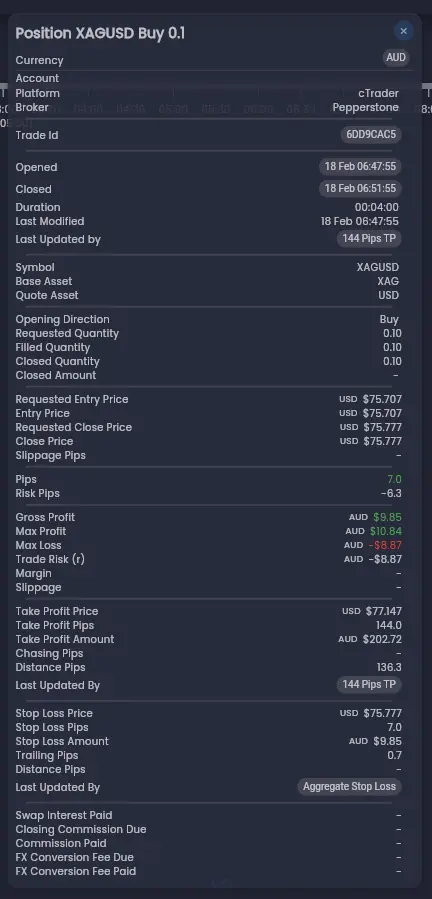
Key features of the Trade Details dialog:
- Open and close times — The entry and exit timestamps are clickable. Clicking a timestamp jumps the analysis timeline to that point, allowing you to inspect the state of the strategy at the exact moment the trade was opened or closed.
- Rule links — Links to the rules that last updated the trade are provided. Clicking a rule link opens the Rule State View for that rule, connecting the trade back to the logic that drove it.
Trade Logs
The Trade Logs provide a chronological record of all trading activity in the strategy. Unlike the Trade List which shows one row per trade, the Trade Logs show individual trade events — each action taken for every trade throughout the execution lifecycle.
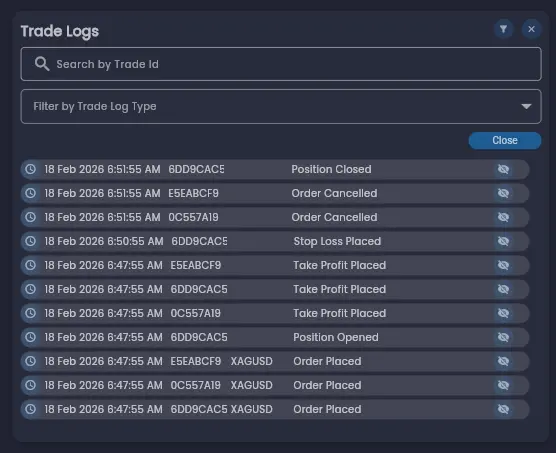
Trade logs can be filtered to show:
- A specific trade — Isolate the lifecycle events for a single trade to trace it from entry through to exit.
- A specific event type — Show only events of a particular type (such as order placements, fills, or cancellations).
This enables you to examine the key actions taken for a trade and the timing of each specific trading event. By clicking the clock icon on a trade log entry, you can jump to the specific time of that event in the timeline and analyse the state of the strategy at that moment.
To investigate why a trade was closed at a particular time, filter the Trade Logs to that specific trade, find the closing event, then click the clock icon to jump to that moment. From there, inspect the exit rule's state to understand the conditions that triggered the close.
Data Sources Dialog
The Data Sources dialog displays the values of each data source in the strategy at the current point in the timeline. This shows the latest price data received from the external broker that that triggered the price data rule execution.
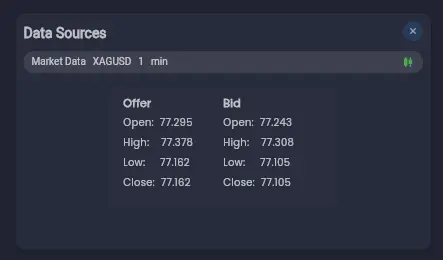
Reviewing data source values is useful when you need to verify that the strategy was receiving the expected input data, or when debugging a rule that produced an unexpected result — the data source values can confirm whether the issue was with the rule's configuration or in the data it received.
Putting It All Together
The inspection tools work together to provide a complete picture of your strategy's behaviour. A typical investigation workflow might be:
- Open the Trade List and identify a trade of interest.
- Double-click the trade to open the Trade Details and click the open time to jump to that moment in the timeline.
- Inspect the Rule State View for the entry rule to understand why the trade was opened, including the execution dependencies that were satisfied.
- Use the playback controls to step forward through the trade and observe how rule states evolved.
- Check the Data Sources to verify the market data the strategy was working with.
- Review the Trade Logs to trace the full lifecycle of the trade from entry to exit.
Whether you are debugging complex conditional logic or verifying the impact of a specific market event, these tools empower you to reconstruct and understand every decision made by your algorithm — step by step.
Was this helpful? Let us know