The Analysis Screen
Once a strategy execution has completed — whether from a backtest, a paper trade, or a live deployment — it is important to go beyond the summary metrics and investigate what actually happened during execution. The analysis screen provides a visual interface for inspecting rule activity, strategy state, price data, and trade outcomes at the end of a strategy run.
Accessing the Analysis Screen
To open the analysis screen, navigate to the Strategy Results or Backtest Results table. On the far right of each row, click the View State icon (the eye icon). This opens the analysis screen for that specific execution.
The analysis screen is available for any completed strategy execution, regardless of the analysis mode that was used. What differs between modes is the level of detail available for inspection:
- Final State (No Analysis) — The default mode for strategies running iterative backtests. Only the final state of the strategy is available for review.
- Full, Time-Based, or Trade-Level Analysis — When a backtest is run with a higher fidelity analysis mode, the analysis screen gains additional features including a time slider, playback controls, and the ability to step through the strategy execution over time. These features are covered in Timeline and Playback.
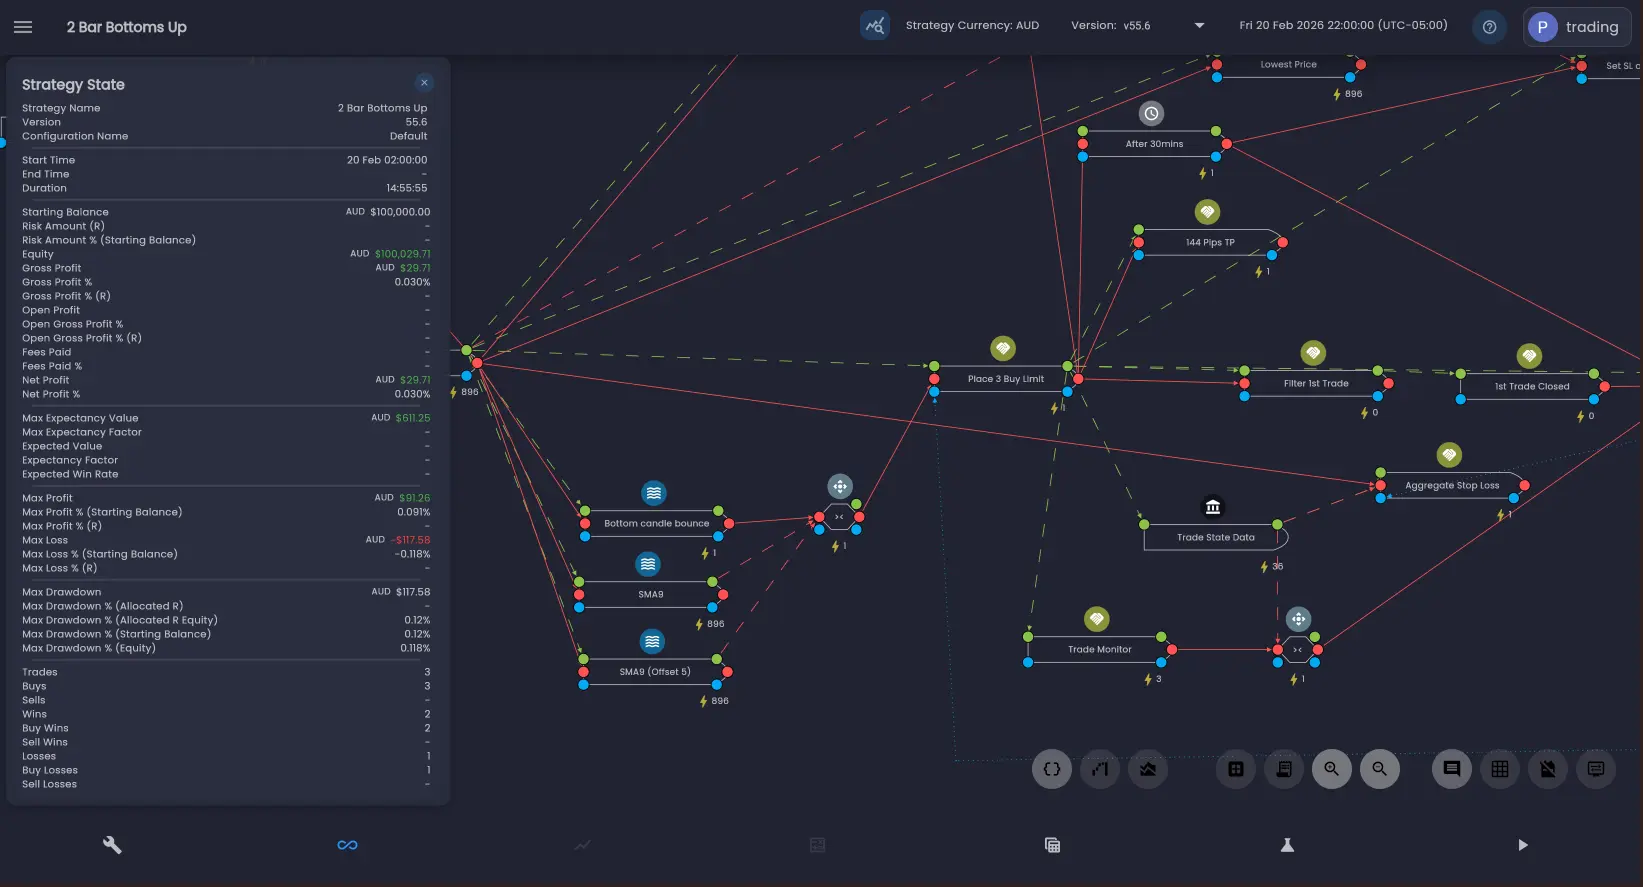
The Canvas Interface
The analysis screen presents a familiar interface that builds on the Strategy Designer. The strategy canvas displays all rules and their connections exactly as they were configured for execution.
You can edit and update rules directly in the analysis view. Note that any changes made here will update the latest version of the strategy.
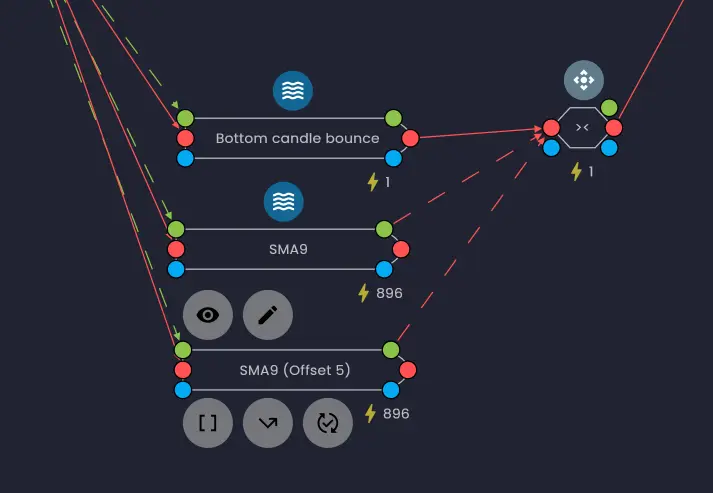
Rule Execution Counts
Each rule in the analysis view displays a lightning bolt icon with a count beside it. This count shows how many times the rule executed during the strategy run. If the lightning bolt icon is dimmed, it means the rule was in a disabled state at the end of the run.
This gives an immediate picture of rule activity — a fast way to assess which logic actually ran and
which rules were inactive. Rules with high execution counts were triggered successfully frequently, while
rules with zero
or low counts may warrant investigation. A standard rule will only execute if it is triggered by another rule
using the after or every> execution logic and any conditional execution dependencies
evaluate to true. For data source rules, the rule will execute if the rule recieves a data event. For time
bound rules, the rule will execute if the based on the time schedule configured.
Tip: Keep an eye out for rules that have subtle configuration that determines when the rule executes. An example is the highest price rule. The rule can fire every time it receives a new value and emit the highest price received or wait until the latest price received is the highest price before triggering an execution.
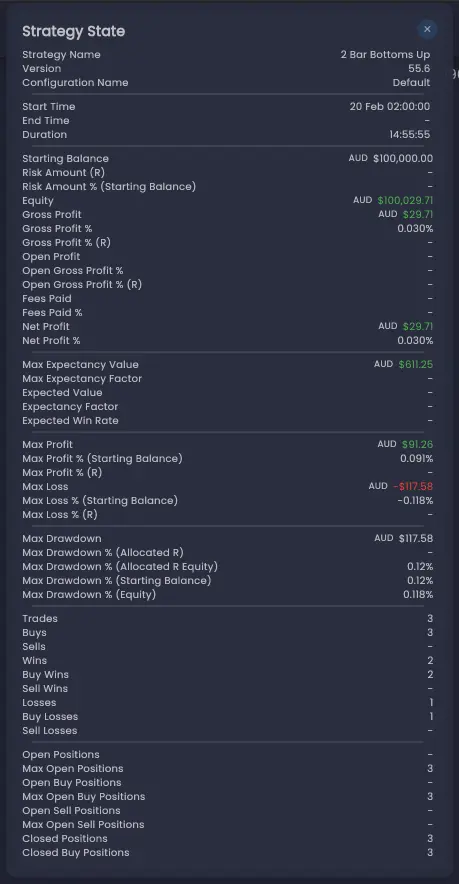
Strategy State Data
Click Show Strategy State  to view the final values of all the Strategy State Data fields.
These are the same fields that are available during strategy execution for use as
input data or in
execution dependencies.
to view the final values of all the Strategy State Data fields.
These are the same fields that are available during strategy execution for use as
input data or in
execution dependencies.
Reviewing the strategy state at the end of a run provides insight into the final state of the strategy.
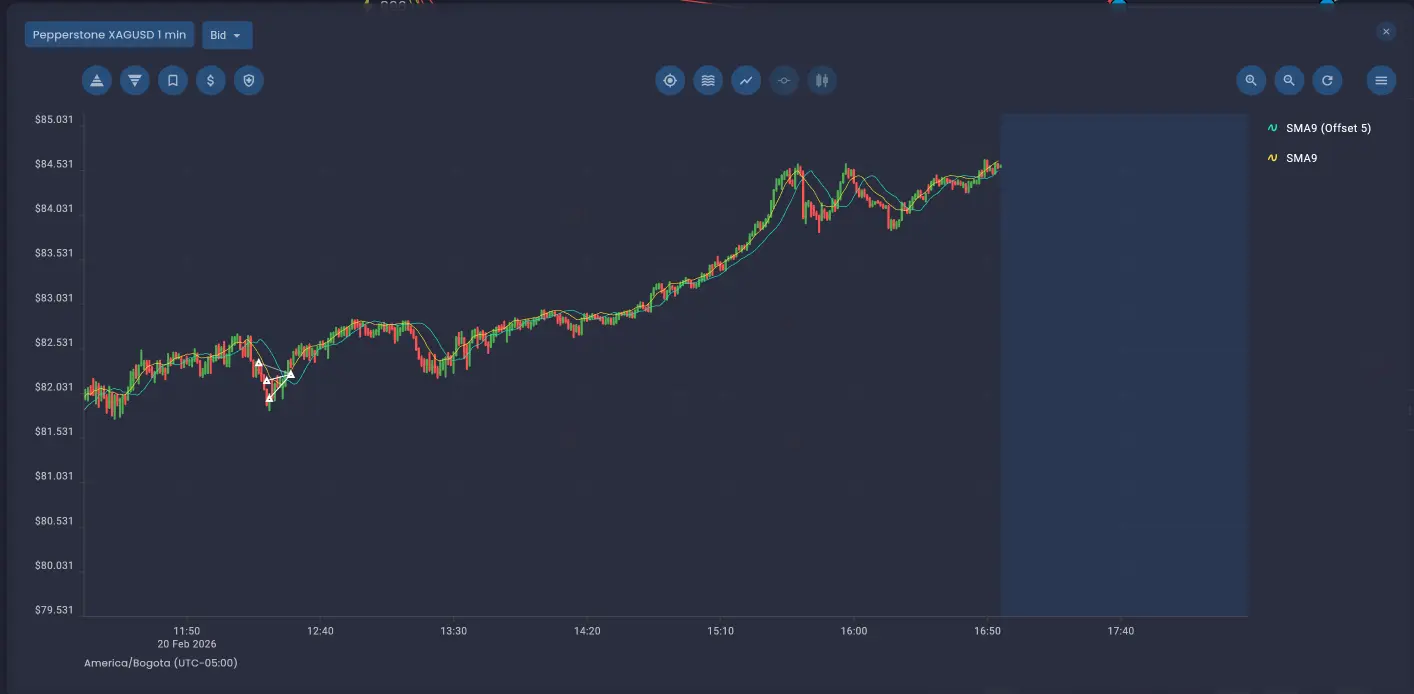
Price Chart
The price chart is available within the analysis screen by clicking  , offering a timeline view of trades plotted against
the market data for the execution period.
, offering a timeline view of trades plotted against
the market data for the execution period.
- Buy trades are marked with an up triangle.
- Sell trades are marked with a down arrow.
Any technical indicators that were part of the strategy are plotted alongside the price data on the chart. You can zoom and pan the chart, and toggle crosshairs or tooltips to examine precise price and time data for individual candles or trade markers.
When using a higher fidelity analysis mode, the price chart gains additional features including a vertical time position line and the ability to click a candle or trade tooltip to jump to that point in the strategy timeline. See Price Chart in Timeline and Playback for details.
Inspecting Rules
To inspect a specific rule, click on it in the canvas. In addition to the editing options, you will see a
View icon ![]() — this opens the Rule State View.
— this opens the Rule State View.
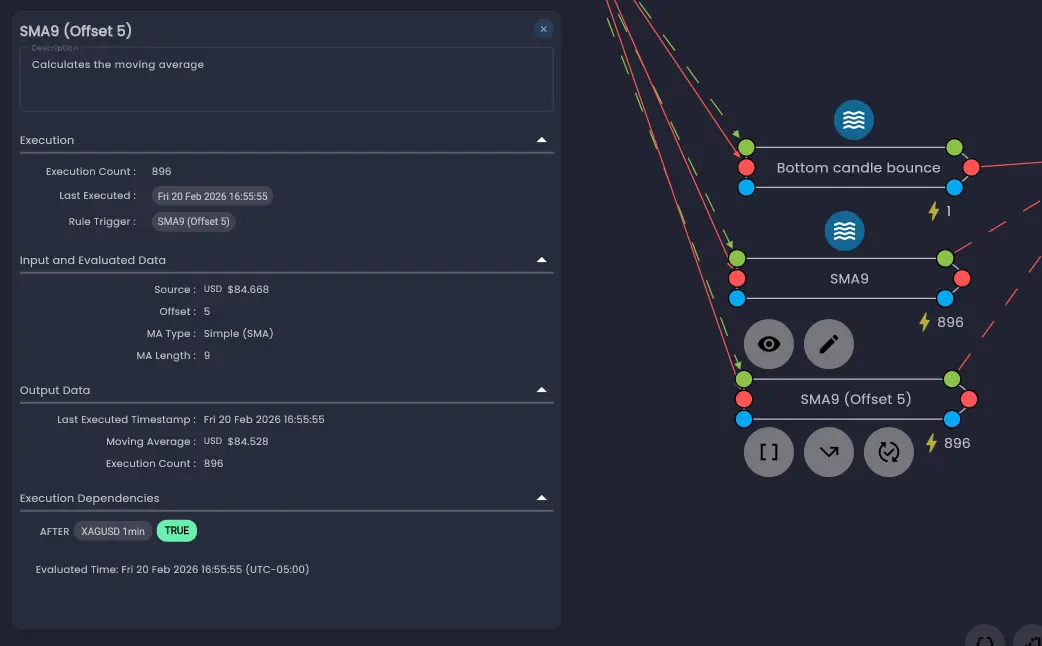
The Rule State View displays several sections of information about the rule at the end of execution:
- Execution — How many times the rule fired, the last time it ran, and which rule triggered it. It also logs the last change to the rule's activation state — when it was enabled or disabled, and by which rule.
- Input and Execution Data — The internal data of the rule at the current point in the strategy. In this case, this will be the end of the stategy timeline. This includes both inputs and computed values used by the rule during execution, referred to as meta-data.
- Output Data — The outputs from the rule's last run. If trades were placed, their IDs are listed and clickable. For price data rules, this includes the computed price values for candles and price variants.
- Execution Dependencies — The logical conditions for triggering the rule. Each condition is shown as true or false, with links to the source rules that triggered them or passed data values. This is key for debugging complex logic chains where rule outputs feed into other rule triggers.
For a full walkthrough of each section, see Inspecting Rules and Trades.
Trade List
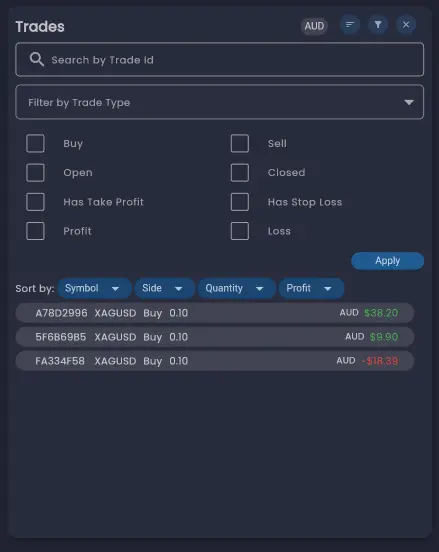
Click the Show Trade List  button to view all trades generated by the strategy during execution.
The trade list dialog allows you to:
button to view all trades generated by the strategy during execution.
The trade list dialog allows you to:
- Filter by type and direction — Narrow the list to specific order types or trade directions.
- Sort the list — Reorder trades by different criteria using the sort button.
- View trade details — Double-click a trade to open its full details, including entry and exit timing.
For more detail on trade inspection features, including the Trade Details dialog, Trade Logs, and the Data Sources dialog, see Inspecting Rules and Trades.
Moving to Higher Fidelity Analysis
Reviewing the final state gives a clear snapshot of what the strategy did, but to deeply understand its
dynamics over time, move to a higher fidelity analysis mode. You can re-run a single backtest iteration with
a more detailed analysis mode by clicking the lab flask icon ![]() on the iteration row in the
Iteration Results screen.
on the iteration row in the
Iteration Results screen.
For a comparison of available analysis modes, see Analysis Modes on the Strategy Execution Iterations page.
When a backtest is run with Full Analysis, Time-Based Analysis, or Trade-Level Analysis mode, the analysis screen gains powerful timeline navigation features covered in the next page.
Was this helpful? Let us know