News Catalyst
Bitcoin goes into this Sunday session as the only major risk asset trading 24/7 while two separate shocks are still being priced. The first is macro: the prior week's US inflation data raised the odds of a Fed rate hike, a repricing that hits BTC and spot-ETF flows (IBIT) directly because both trade as high-beta liquidity plays. The second is geopolitical and landed over the weekend, when equity and futures markets were closed: Trump said Iran was probably responsible for an attack on a Saudi pipeline, while Iran and the UAE backed a joint BRICS statement urging restraint. Headlines that alternate between escalation and de-escalation produce the tape this strategy is built for: sharp intraday spikes into obvious levels that get rejected just as quickly, leaving long upper or lower wicks on the 15-minute chart. There are no high-impact releases on today's economic calendar, so the scheduled risk sits at the reopen instead. CME Bitcoin futures restart at 18:00 ET and the Asian session follows, and both tend to produce the first real test of the weekend's range. Weekend liquidity is thin, so rejections can travel further than usual, but so can false breaks. Expect a wider ATR and size down to match.
Trade Summary
This strategy trades rejection candles at levels the market has already defended. It waits for BTCUSD to test the prior 24-hour high or low, requires a Candle Pattern that proves the test failed (a Shooting Star at resistance or a Hammer at support), and only enters once the next bar confirms that momentum has flipped. The Price Level rule supplies the location, the candle supplies the evidence, and ATR sizes the risk. It addresses a common candlestick-trading problem: shooting stars and hammers show up constantly on a 15-minute crypto chart, and most of them sit in the middle of a range where they mean nothing.
The strategy is directionally neutral. It takes shorts off failed highs and longs off failed lows. On a headline-driven weekend like this one, expect a slight short skew, because rate-hike repricing and geopolitical risk make rallies more likely to stall. It suits volatile, two-way markets where price probes liquidity above and below recent extremes and then snaps back, which is common in crypto when futures markets are closed and order books are thin. It struggles in clean one-way trends, where every "rejection" at the prior high is just a pause before the next leg higher.
The Anatomy of the Trade
The Logic: What Inefficiency Are We Exploiting?
Obvious levels such as the prior day's high or low attract clustered stop orders and breakout entries. When price reaches one of them, those orders fill in a burst and push price through the level. If no fresh buying or selling arrives behind that burst, the move runs out of fuel within the same bar and price falls back inside the range. The trapped breakout traders then become forced sellers or buyers on the way back. That leaves a recognisable footprint: a long wick through the level and a close near the opposite end of the bar. That wick is the market telling you, in one candle, that the level held. The strategy exploits the forced unwind of traders who bought or sold the break, because the unwind supplies the momentum for the move back.
No single element is enough on its own. A shooting star in mid-range is noise, a level test without rejection is a breakout, and a rejection candle that the next bar immediately reclaims is a failed signal. The edge comes from confluence: the Price Level rule makes sure the candle forms where trapped orders actually sit, the candle pattern shows those orders were absorbed, and the follow-through bar confirms that momentum has turned rather than paused. Waiting for that third bar costs some entry price but removes a large share of the rejection candles that get reversed straight away.
Setup Requirements
- Primary indicator: Candle Pattern — Shooting Star for short setups and Hammer for long setups, using the default wick-to-body definition (wick at least 2× the body, close in the outer third of the bar)
- Confirmation: Price Level test (the signal bar's high reaches the prior 96-bar high, or its low reaches the prior 96-bar low, within 0.25× ATR) plus a follow-through bar that closes beyond the signal candle's body
- Risk management: ATR (14-period) for volatility-adjusted stop placement
- Primary Symbol: BTCUSD — it trades 24/7 and reacts to macro and geopolitical headlines while other markets are shut, and liquidity around round numbers and prior extremes is thin, which produces clearly defined sweep-and-reject candles
- Timeframe: 15-minute charts. 96 bars equals exactly 24 hours, so the prior-day extreme is a natural level, and a 15-minute wick reflects a real failed auction rather than one aggressive order, which is often all a 1-minute wick shows
- Adaptability: The logic ports to ETHUSD and to US index CFDs around the prior session high and low. On instruments with a daily session close, use the session's extremes instead of a rolling 96-bar window, and re-fit the ATR multiplier, since equity indices run a far lower ATR-to-price ratio than crypto
Entry Rules
Every entry needs all three conditions across two consecutive bars. A rejection candle without the level, or without the follow-through, does not count as a signal.
- Short entry: The signal bar's high reaches or exceeds the prior 96-bar high (within 0.25× ATR(14)) and the signal bar closes as a Shooting Star and the next bar closes below the Shooting Star's body low
- Long entry: The signal bar's low reaches or undercuts the prior 96-bar low (within 0.25× ATR(14)) and the signal bar closes as a Hammer and the next bar closes above the Hammer's body high
Enter at the close of the confirmation candle. That is the follow-through bar, not the rejection candle itself. If the follow-through bar fails to close beyond the body, cancel the setup. Do not carry it forward to later bars.
Exit Rules
- Stop loss: 1.5× ATR(14) from entry price, above entry for shorts and below for longs. On most setups this places the stop beyond the rejection wick. If it doesn't, the wick was unusually long relative to volatility, so skip the trade rather than widening the stop
- Take profit: Minimum 2:1 reward-to-risk. If the ATR-based stop sits $360 from entry, the target is at least $720 away
- Secondary exit: Close the trade on an opposing candle signal at the other extreme (a Hammer at support while short, or a Shooting Star at resistance while long), or after 16 bars (4 hours) if neither stop nor target has been hit. A rejection trade that has not moved within four hours has lost the momentum it was entered for
Whichever condition triggers first closes the trade. The stop loss is non-negotiable. Never move it further away, and never cancel it because the level "should" hold. Once price closes back beyond the wick, the thesis is gone, and in crypto a failed rejection often becomes a fast breakout in the opposite direction.
Risk Management
- Risk per trade: 1–2% of account equity. Use the lower end on weekends and during headline-driven sessions, when thin books let slippage run past the stop
- Risk-to-reward ratio: Minimum 2:1. At that payoff the strategy breaks even at roughly a 34% win rate before costs
- Position sizing: Size from the stop distance. Risking 1% of a $25,000 account is $250. If ATR(14) is $240, the 1.5× stop is $360, which gives a position of approximately 0.69 BTC ($250 ÷ $360)
- Maximum concurrent positions: One BTCUSD position at a time, and no more than two positions across crypto overall. BTC, ETH and the major altcoins move as a single risk trade during macro-driven sessions
SHORT ENTRY:
  Signal bar high >= prior 96-bar high (within 0.25 × ATR)
  AND Signal bar closes as Shooting Star
  AND Next bar closes below Shooting Star body low

LONG ENTRY:
  Signal bar low <= prior 96-bar low (within 0.25 × ATR)
  AND Signal bar closes as Hammer
  AND Next bar closes above Hammer body high

STOP LOSS:   1.5 × ATR(14) from entry

TAKE PROFIT: 2:1 minimum reward-to-risk
             // Or opposing candle signal, or 16 bars elapsed

RISK:        1–2% of account per trade

TIMEFRAME:   15-minute
SYMBOL:      BTCUSD
Copy the block above into a Strategy Note in the Strategy Builder so the rule set sits alongside the strategy as you build it.
Common Pitfalls
Candlestick patterns are easy to spot and easy to over-trust. These mistakes most often turn a disciplined rejection strategy into ordinary pattern-chasing.
Trading Rejections in a Dead Range
When BTCUSD compresses into a narrow overnight range, the prior 96-bar high and low sit close together and price touches both repeatedly. Almost every bar then has a wick near one of the levels, and the pattern rule fires constantly. None of those rejections means anything, because no one is trapped: nobody traded the break. If the 96-bar range is less than roughly 3× ATR(14), there is no real level to reject and the strategy should stand aside. The setup needs a range wide enough that reaching the extreme was an event.
Ignoring Crypto-Specific Event Risk
BTCUSD reacts to US CPI, payrolls and FOMC decisions like any risk asset. It also reacts to events other markets don't have: spot-ETF flow reports, exchange outages, large liquidation cascades, regulatory headlines, and the CME futures reopen on Sunday evening. A shooting star printed in the minute a headline hits is a liquidity vacuum, not a failed auction. Stand aside for fifteen minutes either side of high-impact US releases and the CME reopen, and ignore any signal bar whose range exceeds 3× ATR(14). Bars that extreme are driven by news or liquidations, not by tested levels.
Skipping the Follow-Through Bar
A well-formed shooting star right at the prior-day high is tempting to short immediately, and the entry price would be better. The problem is that a large share of rejection candles on crypto charts are simply reclaimed on the next bar, and those are exactly the trades the follow-through condition exists to filter out. Entering on the rejection candle alone is a different strategy with a different, and usually worse, win rate. Two or three complete setups per day is normal. A day with none is fine.
Curve-Fitting the Pattern Definition
Candle pattern rules have several tunable parameters: the wick-to-body ratio, the close position, the level lookback and the proximity tolerance. Adjusting all four until the backtest looks perfect is easy, and the result tends to describe one specific run of history. If performance collapses when the wick ratio moves from 2.0 to 2.5, or the lookback from 96 to 80 bars, you have fitted noise rather than found an edge. Fix the pattern definition first, test only a small grid around it, and confirm the results on a period the tuning never saw.
Revenge Trading After a Squeeze
The worst trade in this system is a rejection that fails and turns into a breakout. Price rips through the stop, and the next bar looks like an even better shooting star a little higher. Shorting it again to "get back" the loss is how one normal losing trade becomes three. After two consecutive stop-outs at the same level, treat that level as broken and take no further signals there for the rest of the session. Set a daily loss limit of 3–4% of equity in advance and stop when you hit it.
Build Strategy using Arconomy
Open the Strategy Designer and create a new strategy called "BTCUSD Shooting Star Rejection". The build below covers the short side. The long side mirrors it with a Hammer at the prior 96-bar low and a close above the Hammer's body.
| Step | Rule(s) Required | Description | Key Configuration |
|---|---|---|---|
| Data | Price Data | Configure the Symbol and timeframe the strategy runs on |
|
| Entry | Candle Pattern | Detect a Shooting Star rejection candle on bar close |
|
| Filter | Price Level | Require the signal bar to test the prior 24-hour high |
|
| Filter | Capture Value, Compare Values | Store the Shooting Star's body low and require the next bar to close below it |
|
| Filter | Logic | Combine the pattern, level test and follow-through so entry fires only on full confluence |
|
| Risk | ATR, Place Trade | Size the trade from account risk and attach the ATR-derived stop and target |
|
| Exit | Candle Pattern, Date Time | Close early on an opposing Hammer at the 96-bar low, or once the trade has been open for four hours |
|
| Backtest | Run backtest |
|
Backtest Considerations
Test on at least twelve months of 15-minute BTCUSD data. Crypto regimes change quickly, and a shorter window can easily fall entirely inside one bull or bear phase. The sample should include a sustained trend (where this strategy will struggle), a long choppy range (where it will over-fire unless the range-width filter is working) and several headline-driven volatility spikes like this weekend's. Review weekend and weekday results separately: thin weekend books produce cleaner sweeps but worse fills, and you need to know which part of the week the edge actually comes from.
Watch three metrics. Profit factor should clear 1.3 after costs. Maximum drawdown matters more than total return: a rejection strategy's worst periods come during strong trends, when it shorts every new high, so the drawdown shows how much trend exposure you are carrying. Exit distribution is the third. If the 16-bar time stop closes more trades than the 2:1 target, the follow-through bar is not confirming real momentum and the pattern or level definition needs tightening. The Arconomy backtesting documentation covers how each metric is calculated.
Cost assumptions decide whether this strategy has an edge at all. BTCUSD CFD spreads vary widely by broker and widen sharply on weekends, during liquidation cascades and around the CME reopen, so model spread by session and day of week rather than as one average. Add slippage of at least 0.02–0.05% of price per side for entries at bar close, and more for signal bars with an unusually large range, because those are exactly the moments the order book is thinnest. Exchange-specific price spikes (single-venue wicks that never traded elsewhere) can create false level tests. Check that your data feed is aggregated or comes from the venue you will actually trade on.
Key Takeaways
- The edge is the forced unwind of traders who bought or sold a break of the prior 24-hour extreme; a Shooting Star or Hammer at that level is the visible sign that the break failed.
- Confluence is what makes the strategy work: the Price Level rule provides location, the candle pattern provides evidence of rejection, and the follow-through bar confirms momentum has turned. A candle without the other two is not a setup.
- ATR-based stops at 1.5× with a minimum 2:1 target keep the strategy profitable above roughly a 34% win rate, and a four-hour time stop closes rejection trades that never picked up momentum.
- Stand aside in narrow ranges under roughly 3× ATR, around high-impact US releases and the CME futures reopen, and at any level that has already stopped you out twice in the same session.
- Backtest over at least twelve months covering trending, ranging and headline-driven regimes, analyse weekend and weekday trades separately, and confirm results hold across nearby pattern settings.
Credits
The strategy idea originated from the following YouTube channel. Concepts have been adapted and structured for systematic implementation by Arconomy.
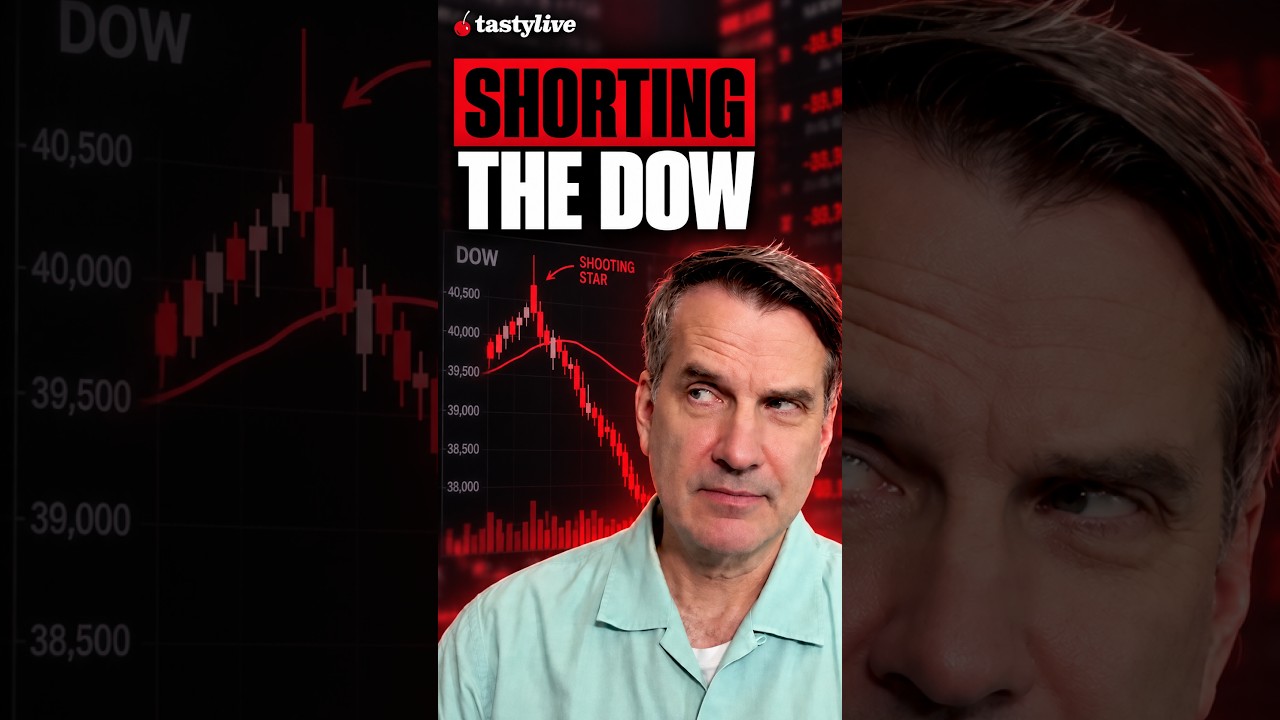
In this tastylive segment, Tim Knight points to the shooting star candle that marked the Dow's lifetime high in early August, which was followed by a decline of roughly 3,000 points. This post takes that idea of a single rejection candle at a significant high and turns it into a rule-based BTCUSD strategy, with a Price Level test defining "significant" and a follow-through bar confirming the reversal.