News Catalyst
The S&P 500 closed the prior session up 1.08% alongside a Dow gain of over 1% and a 1.20% move in the NASDAQ after US August CPI held at 3.4%, landing in line with expectations and removing the tail risk of an upside inflation surprise. The same print pushed long-end bond yields to a 22-year high, which means the index is being repriced against a moving discount rate rather than drifting sideways — exactly the condition that produces directional intraday legs on US500 rather than the chop that kills crossover systems. There are no high-impact scheduled releases on today's economic calendar, so the dominant flow is the continuation and digestion of the CPI move itself: expect elevated range through the 09:30–11:30 ET cash-open window and again into the close, with the mid-session lull the most likely source of false signals. A news-driven day with a clean directional bias and no pending binary event is the most favourable backdrop this strategy gets, but the elevated yield volatility also means reversals can be sharp — the ATR-based stop is doing real work here, not decoration.
Trade Summary
This is a trend-following intraday system that uses a Double Exponential Moving Average (DEMA) as the trend arbiter on 5-minute US500 charts, with Volume confirming participation and a Candle Pattern confirming the turn. The problem it solves is lag: a standard EMA on a 5-minute index chart gives back a meaningful portion of each leg before it flips, and by the time it confirms, the move is half over. DEMA applies a double-smoothing correction that tracks price with materially less lag than a same-period EMA while retaining a usable amount of smoothing, which is what makes a crossover system viable on a timeframe this fast.
The strategy is directionally neutral by construction — it takes both long and short crossovers — but on a day like today it will skew long, because the post-CPI bid in US500 means upside crossovers are far more likely to find follow-through than downside ones. It is built for trending and high-volatility regimes: macro-driven sessions, cash-open expansion, and post-data repricing. It will underperform badly in a low-volatility, range-bound tape, where DEMA's responsiveness becomes a liability and price whipsaws across the line repeatedly. Volatility itself is measured and priced with ATR, which sets the stop distance and, through the 2:1 requirement, the target.
The Anatomy of the Trade
The Logic: What Inefficiency Are We Exploiting?
Intraday index moves are not smooth — they arrive in bursts as passive flow, hedging demand, and systematic rebalancing hit the book at the same time. When those bursts start, the first traders positioned in the direction of the burst capture the cleanest part of the move; everyone confirming with a slower average arrives after the impulse has already been paid out. DEMA exploits that timing gap. By removing a large share of the lag inherent in exponential smoothing, it flags the shift in control earlier in the leg, which is where the expectancy lives. The inefficiency is not that the market is wrong about direction — it is that most trend-following tools are structurally late, and on a 5-minute chart late is the same as wrong.
The trade-off is that a faster line is a noisier line, and this is where the other two inputs earn their place. A volume expansion above the recent average tells you the crossover is being driven by real participation rather than a thin-liquidity drift, and the candlestick confirmation — a Bullish Engulfing for longs, a Bearish Pin Bar for shorts — shows that the bar in which control changed hands actually closed in the direction of the signal rather than being rejected. Requiring all three creates confluence: the trend tool says direction, volume says conviction, and the candle says the bar closed on the right side of the fight. Individually each is a weak signal on 5-minute index data. Together they cut the signal count substantially and remove most of the crossovers that reverse within two bars.
Setup Requirements
- Primary indicator: DEMA with default settings (20-period, close price) plotted on the 5-minute chart. Price crossing the DEMA line defines trend direction
- Confirmation: Bullish Engulfing pattern (long entries) / Bearish Pin Bar (short entries), plus Volume on the signal bar above its 20-period average
- Risk management: ATR (14-period) for volatility-adaptive stop-loss placement
- Primary Symbol: US500 — deep, continuously quoted index liquidity with tight spreads, and a direct response function to US macro data, which is what generates the sustained intraday legs a crossover system needs
- Timeframe: 5-minute charts. Fast enough that DEMA's reduced lag translates into a real entry-price advantage, slow enough to filter tick-level noise. Slower timeframes blunt the specific edge DEMA provides; faster ones drown it in microstructure
- Adaptability: The core logic ports to other liquid indices (US100, GER40, US30) and to large-cap equities, but the DEMA period, ATR multiplier, and volume threshold must be re-fitted per instrument — US100 in particular runs a materially higher ATR-to-price ratio and will need a wider stop multiple
Entry Rules
Every entry requires all three conditions to align on the same bar. If any one is missing, there is no trade — a crossover on its own is not a signal.
- Long entry: Price closes above DEMA(20) having closed below it on the prior bar and Volume on the signal bar exceeds its 20-period average and a Bullish Engulfing pattern completes on that bar
- Short entry: Price closes below DEMA(20) having closed above it on the prior bar and Volume on the signal bar exceeds its 20-period average and a Bearish Pin Bar completes on that bar
Enter at the close of the confirmation candle. Do not front-run the cross while the bar is still forming — intrabar crosses that fail to hold into the close are the single largest source of losing trades in this system.
Exit Rules
- Stop loss: 1.5× ATR(14) from entry price — below entry for longs, above entry for shorts. The ATR basis widens the stop automatically during high-volatility sessions like today's post-CPI tape and tightens it when the range contracts, so the stop reflects current conditions rather than a fixed point value that is wrong most of the day
- Take profit: Minimum 2:1 reward-to-risk. If the ATR-derived stop sits 6 index points from entry, the target is at least 12 points
- Secondary exit: Price closes back through DEMA(20) against the position on two consecutive bars. One close through the line is noise on a 5-minute chart; two is a trend failure and the reason for the trade no longer exists
Whichever condition triggers first closes the trade. The stop loss is non-negotiable — it is never widened, never moved to give a losing trade room, and never cancelled because a level "should" hold. A DEMA system takes a lot of small losses to pay for a smaller number of large wins, and moving stops is precisely how that distribution gets inverted.
Risk Management
- Risk per trade: 1–2% of account equity, sized down to the lower end of that band on days with elevated macro volatility
- Risk-to-reward ratio: Minimum 2:1. At a 2:1 payoff the strategy remains profitable above a roughly 34% win rate before costs, which is the margin of safety a fast crossover system needs
- Position sizing: Size from the stop distance, not from conviction. Risking 1% of a $25,000 account is $250; if ATR(14) is 4.0 index points, the 1.5× stop is 6.0 points, giving a position of approximately 41 units at $1 per point ($250 ÷ 6.0)
- Maximum concurrent positions: One US500 position at a time, and no more than two positions across correlated index instruments — US500, US100, and US30 are effectively the same macro trade during a data-driven session
LONG ENTRY:
  Price closes above DEMA(20) from below
  AND Volume > 20-period average volume
  AND Bullish Engulfing on signal bar

SHORT ENTRY:
  Price closes below DEMA(20) from above
  AND Volume > 20-period average volume
  AND Bearish Pin Bar on signal bar

STOP LOSS:   1.5 × ATR(14) from entry

TAKE PROFIT: 2:1 minimum reward-to-risk
             // Or 2 consecutive closes back through DEMA

RISK:        1–2% of account per trade

TIMEFRAME:   5-minute
SYMBOL:      US500
Copy the block above into a Strategy Note in the Strategy Builder so the rule set sits alongside the strategy as you build it.
Common Pitfalls
A fast trend tool on a fast timeframe punishes sloppy execution harder than most systems. These are the ways traders most reliably turn a workable DEMA crossover into a losing one.
Trading It Through Low-Volatility Ranges
DEMA's reduced lag is an advantage only when price is actually going somewhere. In the typical US500 midday lull — roughly 11:30 to 14:00 ET — the index compresses into a few points of range and price oscillates across the DEMA line repeatedly, firing crossover after crossover that dies within two bars. If ATR(14) has fallen below its own 20-period average, the crossover signal carries no information and the correct position size is zero. Adding a Date Time session filter to skip the lull removes a large block of these trades without removing any of the good ones.
Ignoring the Event Calendar
US500 responds violently to CPI, PCE, non-farm payrolls, FOMC decisions and the press conference that follows, plus Treasury auctions — and with long-end yields at a 22-year high, auction results are currently moving equities more than they normally would. A crossover printed in the first thirty seconds after a release is a liquidity artefact, not a trend signal, and the spread at that moment can be several times its normal width. Stand aside for the fifteen minutes either side of any high-impact US release and let the first post-event range establish itself before taking a signal.
Relaxing the Confirmation Requirements
The three-condition filter cuts the raw crossover count sharply, and after a quiet morning the temptation to take a cross on "close enough" volume or an almost-engulfing candle is strong. That temptation is the strategy's most common failure mode, because the trades it produces are exactly the marginal-participation crossovers the filter was designed to exclude. A cross without volume expansion and a completed pattern is not a partial signal — it is a different, negative-expectancy strategy. Four clean setups a session is a normal day; zero setups is an acceptable one.
Over-Optimising the DEMA Period
Because DEMA responds so quickly, small changes to its period produce large swings in backtest results, which makes it unusually easy to tune your way to a beautiful equity curve that describes one specific stretch of history and nothing else. A 20-period DEMA that tests marginally worse than a 17-period one over six months is almost certainly the more robust choice. If the strategy only works at one exact parameter setting and degrades sharply on either side of it, you have fitted noise rather than found an edge. Check that performance holds across a plateau of neighbouring values, and validate on data the parameters never saw.
Revenge Trading Through a Drawdown
This system produces losing streaks by design — a sub-50% win rate with a 2:1 payoff means four or five consecutive losses is an ordinary occurrence, not evidence of failure. The danger is responding to that streak by doubling size to recover, or by taking the next marginal setup out of impatience. Define a daily loss limit of 3–4% of equity in advance and stop trading when it is hit, regardless of how good the next setup looks. The drawdown is a feature of the distribution; the size increase is what turns it into damage you cannot recover from.
Build Strategy using Arconomy
Open the Strategy Designer and create a new strategy called "US500 DEMA Trend Crossover". The build below covers the long side; the short side mirrors it with the cross direction and candle pattern reversed.
| Step | Rule(s) Required | Description | Key Configuration |
|---|---|---|---|
| Data | Price Data | Configure the Symbol and timeframe the strategy runs on |
|
| Entry | Moving Average | Add a DEMA and trigger when price crosses above it from below |
|
| Filter | Volume Data | Require volume expansion on the signal bar to confirm real participation |
|
| Filter | Candle Pattern | Require a Bullish Engulfing close on the same bar as the cross |
|
| Filter | Logic | Combine all three conditions so entry fires only on full confluence |
|
| Risk | Place Trade | Size the trade from account risk and attach the ATR-derived stop and target |
|
| Exit | Moving Average | Close early when price closes back through DEMA against the position |
|
| Backtest | Run backtest |
|
Backtest Considerations
Test this on US500 over a minimum of six months of 5-minute data, and check that the window contains all three regimes the strategy will meet in live trading: a sustained directional trend, an extended low-volatility range, and at least two or three macro-driven volatility spikes of the kind today's CPI print produced. A six-month window drawn entirely from a trending market will flatter a crossover system enormously — that is the environment it is built for — so the range-bound stretches are the more informative part of the sample. Six months of 5-minute bars also gives a large enough trade count for the results to mean something, which a higher timeframe over the same window would not.
Watch three metrics in particular. Profit factor should clear 1.3 after costs; anything between 1.0 and 1.3 is inside the noise band for a system of this trade frequency. Maximum drawdown matters more than the return figure, because it tells you the worst run you must be able to sit through, and a fast crossover system's drawdowns arrive as clusters of small losses during chop rather than as single large hits. Third, check the distribution of exits: if the DEMA re-cross exit is closing far more trades than the 2:1 target is, the signal is firing too late in each leg and the DEMA period or the entry filters need revisiting rather than the target. The Arconomy backtesting documentation covers how each of these is calculated.
Cost assumptions are decisive at this frequency. US500 CFD spreads typically run 0.4–0.6 index points during US cash hours, widening to several points overnight and blowing out momentarily around data releases, so model the spread by session rather than as a single average — a flat all-day spread will understate the cost of exactly the trades this strategy takes. Add at least 0.2–0.3 points of slippage per side for market-on-close-of-bar execution, and more if you intend to trade the first few minutes after the cash open. Exclude holiday sessions and half-days from the sample: thin index liquidity produces volume readings that pass the filter for the wrong reasons and results that will not repeat.
Key Takeaways
- The edge is timing: DEMA's double-smoothing removes much of the lag in a standard exponential average, so the crossover flags a shift in control early enough in a 5-minute index leg for the move to still be worth taking.
- Confluence is what makes a fast line tradeable — the DEMA cross gives direction, volume expansion confirms genuine participation, and the candlestick pattern proves the bar closed on the signal's side; any two without the third is not a setup.
- ATR-based stops at 1.5× with a minimum 2:1 target keep the strategy profitable above roughly a 34% win rate, which is the margin of safety a system that takes many small losses requires.
- Stand aside during the low-volatility midday range and around high-impact US releases — CPI, PCE, payrolls, FOMC and Treasury auctions — where crossovers are liquidity artefacts rather than trend signals.
- Backtest across at least six months covering trending, ranging and news-driven regimes, and confirm performance holds across a plateau of DEMA periods rather than at one tuned value, or you have fitted noise.
Credits
The strategy idea originated from the following YouTube channel. Concepts have been adapted and structured for systematic implementation by Arconomy.
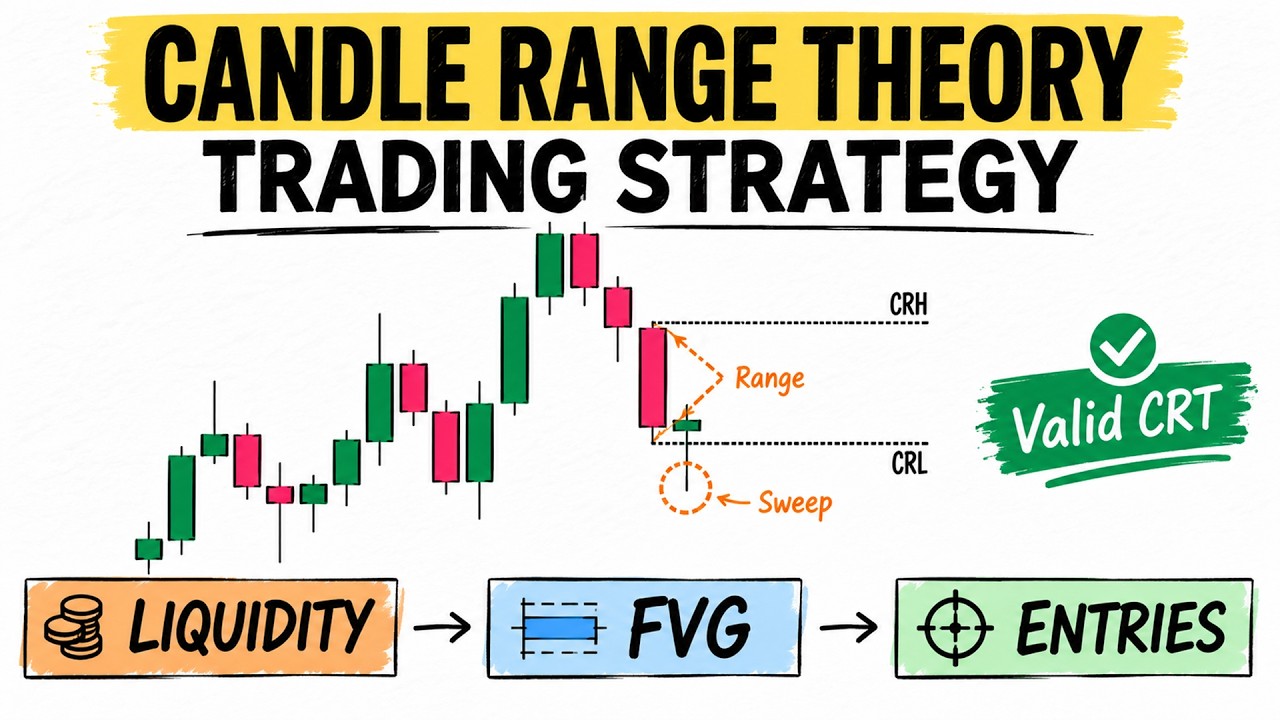
Com Lucro Trader's video walks through Candle Range Theory — reading the candle's range to locate liquidity sweeps and fair value gaps, then timing entries off the bar that reclaims the level — and it is that discretionary "wait for the reclaiming bar to close" principle that this post converts into a systematic rule, with the DEMA cross standing in for the visual level and the engulfing/pin bar confirmation playing the same role as the video's entry candle.