News Catalyst
XBRUSD opens the session with a charged geopolitical backdrop directly relevant to crude oil pricing. The US confirmation that the Iran ceasefire is holding despite an exchange of fire and a fresh attack on the UAE is the dominant headline for energy markets — the kind of two-way risk that fuels sharp intraday spikes followed by mean-reverting fades as headlines settle. Layered on top, US 30-year Treasury yields trading above 5% are tightening financial conditions and pressuring risk assets, which periodically drags crude into sympathy moves untethered from physical supply. Today's only scheduled tier-one print is the Canadian Ivey PMI (forecast 49.9 vs previous 49.7) — low impact for crude directly, but a soft read can reinforce a slow-drift session that suits mean-reversion entries. This stop-and-start pattern of headline shocks followed by liquidity reversion is exactly the regime an RSI reversal system is built to harvest.
Trade Summary
This system trades XBRUSD intraday using a classic RSI overbought/oversold reversal filtered by a closed-bar candlestick confirmation. When the RSI(14) crosses back above 30 after an oversold extreme and a Bullish Engulfing bar prints, the strategy enters long; the mirrored short triggers when RSI(14) crosses back below 70 after an overbought stretch and an Evening Star formation completes. The directional bias is symmetric and the system is built for two-way reversion rather than persistent trend.
The strategy performs best in range-bound, news-reactive markets where headline shocks push price beyond fair value before liquidity providers fade the move. ATR(14) sizes the stop and target so that risk scales with realised volatility rather than fixed pips, which keeps the edge stable as XBRUSD shifts between calm consolidation and headline-driven expansion phases.
The Anatomy of the Trade
The Logic: What Inefficiency Are We Exploiting?
Crude oil is uniquely sensitive to headline shocks — geopolitical risk, inventory data, and OPEC commentary regularly drive price beyond what underlying supply-and-demand justifies. Once the initial impulse is absorbed, market makers and systematic liquidity providers fade the extreme back toward fair value. The RSI(14) crossing back through the 30 or 70 boundary is a quantified marker that the impulse has exhausted, while the candlestick reversal is the price-action signature of the rejection itself.
The combination matters because RSI alone fires too often in a trending tape, and candle patterns alone fire too often in noise. Their confluence filters out the bulk of false signals: only when momentum has objectively rolled over and the bar structure agrees does the system commit capital. The candlestick adds the timing precision RSI lacks, while RSI provides the regime context the bar alone cannot supply.
Setup Requirements
- Primary indicator: RSI(14) with classic 30/70 boundaries on the intraday timeframe.
- Confirmation: Bullish Engulfing for longs, Evening Star for shorts — both evaluated on closed bars only.
- Risk management: ATR(14) for volatility-scaled stop and target placement.
- Primary symbol: XBRUSD (Brent crude) — deeply traded, headline-sensitive, and reverts cleanly after geopolitical impulse moves.
- Timeframe: Day trading on the 15-minute or 1-hour chart — long enough to filter intra-bar noise, short enough to harvest two to four reversal setups per session.
- Adaptability: The same RSI + candle confluence ports to other liquid CFDs and majors (XAUUSD, USOIL, EURUSD) — recalibrate the RSI thresholds (e.g. 25/75) for instruments with different volatility profiles.
Entry Rules
All conditions must align on the same closed bar. No anticipation, no partial bars.
- Long entry: RSI(14) closes back above 30 after printing below 30 within the last three bars and the current bar closes as a Bullish Engulfing pattern.
- Short entry: RSI(14) closes back below 70 after printing above 70 within the last three bars and an Evening Star formation completes on the current bar.
Enter at the close of the confirmation candle. Anticipating the reversal mid-bar is the single largest source of false positives in this system.
Exit Rules
- Stop loss: 1.5 × ATR(14) from entry, placed beyond the extreme of the confirmation candle.
- Take profit: Minimum 2:1 reward-to-risk — target is 3.0 × ATR(14) from entry.
- Signal exit: Close the position if RSI(14) reaches the opposite extreme (above 70 for longs, below 30 for shorts) before the target is hit, or on a bearish/bullish divergence forming against the trade.
The stop loss is non-negotiable. Mean-reversion edges decay rapidly when traders widen stops to "give the trade room" — that is how a structured 1R loss becomes an undisciplined 3R loss.
Risk Management
- Risk per trade: 1–2% of account equity. Reduce to 0.5% during periods of elevated geopolitical tail risk.
- Risk-to-reward ratio: Minimum 2:1. Skip any setup where the 3.0 × ATR target sits inside an obvious structural barrier or VWAP band.
- Position sizing: On a $20,000 account risking 1% ($200), with an ATR-based stop of $0.80 on XBRUSD, the position is approximately $200 ÷ $0.80 = 250 units. Use the platform's risk calculator rather than rounding manually.
- Maximum concurrent positions: One XBRUSD position at a time. Cap total energy-correlated exposure (USOIL, XBRUSD, energy ETFs) to one open position.
SYMBOL:      XBRUSD
TIMEFRAME:   15m / 1h (intraday)

LONG ENTRY:
  RSI(14) crosses back above 30
  AND Bullish Engulfing pattern on close

SHORT ENTRY:
  RSI(14) crosses back below 70
  AND Evening Star pattern on close

STOP LOSS:   1.5 × ATR(14) from entry
TAKE PROFIT: 3.0 × ATR(14) from entry
             // Minimum 2:1 reward-to-risk

SIGNAL EXIT: RSI reaches opposite extreme
             // Or bearish/bullish divergence vs price

RISK:       1–2% equity per trade
Common Pitfalls
RSI reversal systems look simple, but the failure modes are subtle. The traps below cost more equity than any chart pattern misread.
Trading inside a strongly trending tape
RSI can stay pinned above 70 or below 30 for dozens of bars during a strong directional move. Mean-reversion entries against a clean intraday trend are the single highest-loss-rate setup in the system. If the prior 50 bars show consistent higher-highs or lower-lows, stand aside until the structure breaks.
Geopolitical headline shocks specific to crude
OPEC announcements, EIA inventory surprises, and Middle East escalation headlines can blow through a 1.5 × ATR stop in a single tick. Avoid initiating new entries in the 15 minutes before, and 30 minutes after, scheduled energy data releases or while breaking geopolitical headlines are still moving the tape. Let the dust settle before re-arming.
Relaxing the candlestick filter after a missed reversal
Watching a clean RSI bounce play out without an Engulfing print tempts traders to take the next "almost-Engulfing" bar. Both conditions are load-bearing — the candle is what times the entry, the RSI is what justifies it. If either is absent, there is no trade.
Curve-fitting RSI thresholds
Adjusting 30/70 to 25/75 because the last quarter looked better in-sample is textbook over-optimisation. Lock the thresholds before live deployment and only revisit them after at least 100 forward trades. Treat parameter sweeps as diagnostics, not as live tuning.
Revenge trading after a stop-out
Mean-reversion strategies cluster losses during regime shifts — two stop-outs in a row often mark the start of a trend rather than a coincidence. Set a daily loss limit of 3R and stop trading the moment it is hit. The setup will be there tomorrow; the equity required to take it may not.
Build Strategy using Arconomy
The full XBRUSD RSI Reversal Day Trading Strategy can be assembled in the Arconomy Strategy Designer using the rules below. Each row maps a single platform rule to its role in the system.
| Step | Rule(s) Required | Description | Key Configuration |
|---|---|---|---|
| Data | Price Data | Stream the XBRUSD 15-minute or 1-hour candle data into the strategy. |
|
| Entry | RSI | Tracks RSI(14) crossing back through the 30/70 thresholds after an oversold or overbought extreme. Triggers the directional bias for the candle confirmation. |
|
| Entry | Candle Pattern | Requires a Bullish Engulfing bar for longs and an Evening Star formation for shorts to time the entry on the close. |
|
| Risk | Place Trade + Stop Loss | Place the trade with ATR-scaled stop sizing capped at 1–2% of equity. |
|
| Exit | Take Profit | Bank the trade at a fixed 2:1 reward-to-risk multiple, with an opposing-RSI signal exit and divergence exit as backups. |
|
| Backtest | Validate the system across at least 12 months of XBRUSD intraday data covering both range-bound and trending regimes, including OPEC and inventory-release weeks. |
|
Backtest Considerations
Test the strategy on at least 12 months of XBRUSD 15-minute or 1-hour data and ensure the sample includes calm consolidation phases, OPEC-driven trend legs, and at least one geopolitical shock window. Mean-reversion systems generate most of their P&L during range-bound regimes — a backtest dominated by a strong directional move will understate the true edge dramatically.
Focus on profit factor (look for > 1.3 after costs), maximum drawdown (ideally below 15% of starting equity), and win-rate stability across volatility regimes — mean-reversion equity curves are healthier when the win rate sits above 55% and individual losses are tightly clustered around 1R. Cross-reference your assumptions against the Arconomy backtesting documentation to confirm the slippage and spread model matches the live execution venue.
For XBRUSD specifically, model spread at $0.03–0.05 per unit during the London/NY overlap and significantly wider during Asian quiet hours and around the weekly EIA inventory release. Assume at least $0.05–0.10 of slippage on stop-outs around major energy headlines. The strategy's edge survives realistic transaction costs only when both the RSI threshold and the candle confirmation are honoured — turn each filter off independently in backtest as a control to confirm both contribute.
Key Takeaways
- The core edge comes from a clean RSI(14) reversal at 30/70 confirmed by a closed Bullish Engulfing or Evening Star bar.
- Confluence between momentum exhaustion and price-action rejection is what filters genuine reversals from continuation traps.
- ATR-scaled stops and a 2:1 minimum reward-to-risk keep position sizing consistent as XBRUSD shifts between calm and headline-driven regimes.
- Avoid the system during strongly trending tapes and around scheduled energy data or breaking Middle East headlines — both regimes neutralise the mean-reversion edge.
- Lock RSI thresholds and candle definitions before live deployment, and rely on at least 12 months of XBRUSD intraday backtest data including geopolitical shock windows before sizing up.
Credits
The strategy idea originated from the following YouTube channel. Concepts have been adapted and structured for systematic implementation by Arconomy.
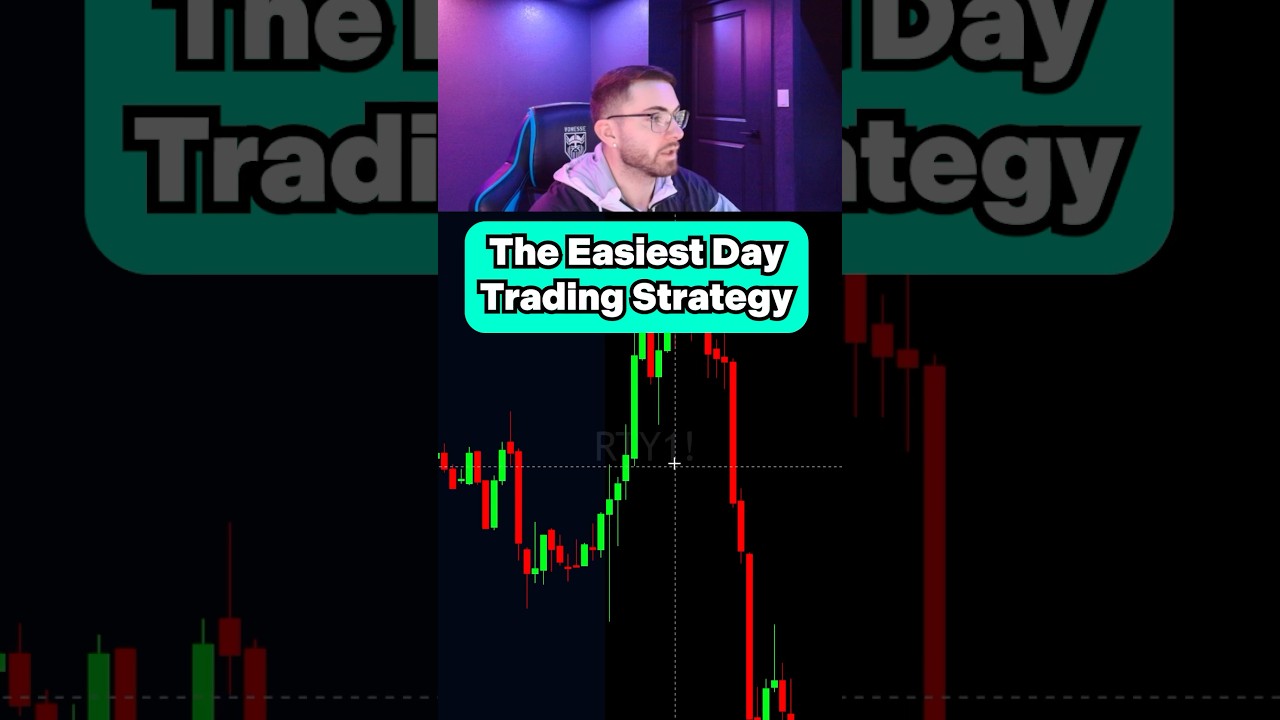
BrandonTrades demonstrates an intraday day-trading workflow built around momentum exhaustion and price-action confirmation — the same two-component logic this post formalises into RSI(14) reversal entries paired with Bullish Engulfing and Evening Star confirmations on XBRUSD.