News Catalyst
The US500 opens today into a tape that is being pulled in two directions, and that tension is exactly what a volume-confirmed breakout system feeds on. Crypto-linked equities are driving the risk-on side after Bitcoin reclaimed $80,000 with more than $220M in 24-hour short liquidations, while Strive’s $81.5M purchase of 1,110 BTC pushed its Nasdaq-listed shares up more than 11% and dragged the broader Nasdaq-100 complex higher with it. Pulling the other way, renewed tariff threats of 50% on Canadian vehicles and steel are rotating money into materials and defence names and away from import-exposed industrials — a rotation that shows up as index-level chop long before it shows up as index-level trend. On the scheduled side the calendar is deliberately light: the RBA Meeting Minutes and the German Ifo Business Climate print (forecast 87.2 versus 86.6 prior) are both low-impact for US equity index futures and land well before the US cash session, so neither threatens the setup with a headline-driven gap. That combination — conflicting sector flows, no dominant macro release, and headline risk that arrives without warning — produces the classic profile this strategy is built for: tight intraday consolidations that resolve violently once real participation arrives, with volume as the only reliable tell that the resolution is genuine.
Trade Summary
This is a breakout system that refuses to trade a breakout on price alone. Price leaving a consolidation range is cheap — it happens dozens of times a session on a 15-minute US500 chart, and most of those moves are stop-runs that reverse within two bars. What separates a real move from a fake one is participation, so the entry trigger here is Volume Data: the breakout bar must print at least 2.0× the 20-bar average volume before any order is considered. The range itself is defined with Price Level boundaries drawn from the Highest Price and Lowest Price of the prior 20 bars, and the whole setup only arms once that range has compressed to under 1.2× ATR(14) in width. Compression first, volume second, price third — in that order.
The strategy is directionally neutral: it takes the long side on an expansion above the range high and the short side on an expansion below the range low, with no house view on where the index “should” go. It performs best in markets that alternate between coiling and expanding — sessions with genuine two-way flow, sector rotation, and an absence of one dominant macro driver, which is precisely today’s tape. It performs worst in slow, low-participation grind days where volume never expands enough to trigger, and in gap-and-run sessions where the day’s entire range is established in the first fifteen minutes and no consolidation ever forms. A Candle Pattern filter on the breakout bar — a Marubozu or Engulfing close — provides the final confirmation that buyers or sellers actually held the level into the close.
The Anatomy of the Trade
The Logic: What Inefficiency Are We Exploiting?
Consolidation is not indecision — it is inventory building. When the US500 compresses into a range on the 15-minute chart, both sides are accumulating positions at similar prices, and every participant in that range shares roughly the same cost basis. Stops cluster immediately outside the boundaries because that is where everyone in the range is proven wrong. When price finally trades through a boundary, two things can happen: either a small amount of opportunistic flow probes the level and gets absorbed by resting liquidity, or genuine institutional size steps in, clears the resting orders, and triggers the stop cluster on the other side. Both look identical on a price chart. Only one of them shows up as a volume expansion.
That is the entire edge: volume is the confluence filter that separates absorption from participation. A 2.0× average-volume breakout bar tells you that the move required real size to happen, which means resting liquidity at that level has been consumed rather than merely tested. Requiring the range to be compressed below 1.2× ATR(14) before arming the setup adds a second layer — it ensures the stop cluster is tight and close by, so the subsequent stop-run has fuel and the risk on the trade is small relative to the expansion that follows. The Marubozu or Engulfing close adds the final piece of evidence: it says the bar did not merely spike through the level and retreat, but held the extension into the bar close, which is the behaviour that distinguishes a continuation from a failed probe.
Setup Requirements
- Primary indicator: Volume Data with a 20-period simple moving average of volume; the breakout bar must print ≥ 2.0× that average.
- Range definition: Highest Price(20) and Lowest Price(20) establish the consolidation boundaries, held as Price Level breakout triggers.
- Compression filter: range width (Highest Price(20) − Lowest Price(20)) must be below 1.2× ATR(14) on the bar before the breakout.
- Confirmation: Candle Pattern — Marubozu or Bullish/Bearish Engulfing on the breakout bar, closing in the outer third of its own range.
- Risk management: ATR(14) sets both the stop distance and the profit target, so position size scales with realised volatility rather than a fixed point value.
- Primary symbol: US500 — deep, continuously quoted volume during the US cash session makes the volume average statistically meaningful, which is the one thing this strategy cannot function without.
- Timeframe: 15-minute charts — long enough for a volume spike to represent genuine institutional participation rather than a single sweep, short enough to catch the expansion before it has already run its full distance.
- Adaptability: the logic transfers to NAS100, GER40 and liquid large-cap equities. It does not transfer cleanly to spot forex, where tick volume is a proxy rather than true traded volume and the 2.0× threshold loses its meaning.
Entry Rules
Every condition below must align on the same bar. A volume spike without a range break is noise; a range break without a volume spike is a probe. Neither is a trade on its own.
- Long entry: range width < 1.2× ATR(14) on the prior bar and the current bar closes above Highest Price(20) and bar volume ≥ 2.0× the 20-period volume average and the bar is a Bullish Marubozu or Bullish Engulfing closing in the upper third of its range.
- Short entry: range width < 1.2× ATR(14) on the prior bar and the current bar closes below Lowest Price(20) and bar volume ≥ 2.0× the 20-period volume average and the bar is a Bearish Marubozu or Bearish Engulfing closing in the lower third of its range.
Enter at the close of the confirmation candle. Do not anticipate the volume print mid-bar — volume is only known once the bar completes, and a bar that looks like a 2.0× spike five minutes in routinely finishes at 1.1×.
Exit Rules
- Stop loss: 1.5× ATR(14) from entry, placed on the opposite side of the broken boundary. If the breakout is genuine, price should not return inside the range.
- Take profit: 3.0× ATR(14) from entry — a 2:1 reward-to-risk minimum, which is what the expansion following a compressed range typically delivers when it works.
- Secondary exit: close the position if price closes back inside the consolidation range for two consecutive bars, regardless of open profit. A failed breakout that re-enters the range usually travels to the opposite boundary.
- Time exit: flat after 16 bars (four hours) if neither the stop nor the target has been reached. Volume-driven expansion is a fast phenomenon; a position drifting sideways for four hours no longer has the edge it was entered on.
The stop loss is non-negotiable. A volume-confirmed breakout that fails does so quickly and violently — the same participation that would have carried the trade is now positioned against it. Widening the stop to “give it room” converts a defined 1.5× ATR loss into an undefined one.
Risk Management
- Risk per trade: 1–2% of account equity. With a strategy that trades relatively infrequently — genuine 2.0× volume breakouts from compressed ranges appear perhaps two to four times per session — there is no case for sizing beyond 2%.
- Risk-to-reward ratio: minimum 2:1. At a 1.5× ATR stop and 3.0× ATR target, the system remains profitable at a win rate above roughly 36% before costs.
- Position sizing: on a $25,000 account risking 1.5% ($375), with ATR(14) at 12 index points, the stop distance is 18 points — giving a position size of $375 ÷ 18 = approximately $20.80 per point. Recalculate on every trade; ATR on the US500 can double between a quiet August session and an FOMC week.
- Maximum concurrent positions: one. Long and short signals on the same instrument are mutually exclusive, and stacking correlated index positions multiplies a single directional bet rather than diversifying it.
SYMBOL:      US500
TIMEFRAME:   15m

RANGE SETUP:
  range_high = Highest Price(20)
  range_low  = Lowest Price(20)
  range_width = range_high − range_low
  compressed = range_width < 1.2 × ATR(14)
                // Setup only arms while compressed = true

LONG ENTRY:
  compressed on prior bar
  AND close > range_high
  AND volume ≥ 2.0 × SMA(volume, 20)
  AND candle = Bullish Marubozu OR Bullish Engulfing
                // Enter at close of confirmation candle

SHORT ENTRY:
  compressed on prior bar
  AND close < range_low
  AND volume ≥ 2.0 × SMA(volume, 20)
  AND candle = Bearish Marubozu OR Bearish Engulfing

STOP LOSS:    1.5 × ATR(14) from entry
                // Placed beyond the broken boundary

TAKE PROFIT:  3.0 × ATR(14) from entry
                // 2:1 minimum reward-to-risk

EXIT EARLY:   2 consecutive closes back inside range
TIME EXIT:    16 bars (4 hours)

RISK:         1–2% equity per trade, max 1 open position
Common Pitfalls
Volume-based breakout systems fail in predictable ways, and almost all of those failures come from relaxing the thing that makes the system work — the volume threshold. The five pitfalls below account for the large majority of the damage traders do to this setup.
Trading Compression That Never Resolves
Low-volatility sessions produce beautiful-looking consolidations that simply never break. The range keeps qualifying as compressed, the setup keeps arming, and price grinds sideways for hours while the trader waits. The danger is not the waiting — it is the impatience that follows. A range that has been compressed for more than 40 bars without a 2.0× volume print is telling you the participants needed to resolve it are not present, and no amount of staring at the chart will summon them. Stand down and let the session develop.
Mistaking News Volume for Breakout Volume
The 2.0× volume filter is trivially satisfied in the minutes after a headline lands — a tariff announcement, a Fed speaker, an index-heavyweight earnings leak. Those bars carry enormous volume and almost no directional information, because the flow is a two-sided repricing rather than a one-sided accumulation. A volume spike that coincides with a scheduled release or a breaking headline is a repricing event, not a breakout, and it reverses far more often than it continues. Today’s calendar is genuinely quiet — the RBA minutes and German Ifo print are both low-impact for US indices — but the tariff news flow is unscheduled, so keep the release calendar open and skip any signal that fires within fifteen minutes of a headline hitting the tape.
Lowering the Volume Threshold to Get More Trades
Two to four qualifying setups per session feels thin, and the obvious fix is to drop the multiplier from 2.0× to 1.5× or 1.3×. Trade count roughly triples. So does the proportion of breakouts that immediately reverse, because 1.3× average volume is close to what an ordinary bar prints and therefore carries almost no information. The threshold is not a dial to be tuned for frequency — it is the entire signal, and diluting it converts a selective breakout system into a random one. If the setup count is genuinely too low, add instruments rather than lowering the bar.
Over-Optimising the Lookback and Compression Parameters
The 20-bar lookback, the 1.2× ATR compression ceiling and the 2.0× volume multiplier form a coherent system: each was chosen to be robust rather than optimal. Sweeping them across a backtest will invariably surface a combination — 23 bars, 1.14×, 2.35× — that materially outperforms on the sample. That combination is describing the specific sequence of sessions in your test window, not the behaviour of the market, and it will not survive contact with the next quarter. If a parameter change only helps within a narrow band and degrades sharply on either side, it is curve fit, not an improvement.
Revenge Trading After a Failed Breakout
Failed volume breakouts sting more than ordinary losses because the setup looked textbook right up until it reversed — the compression was tight, the volume was there, the candle closed strong. The instinct is to immediately take the opposite side, or to take the next marginal setup at double size to recover. Both responses abandon the rule set at exactly the moment the rule set is most valuable, and a two-loss sequence turns into a session-defining drawdown. Cap the day at two losing trades and walk away; the setup will be there tomorrow.
Build Strategy using Arconomy
The US500 Volume Spike Breakout from Consolidation strategy maps directly onto the Arconomy Strategy Designer. The build below wires the volume trigger as the primary entry rule, with the consolidation range, compression filter and candle confirmation gated behind a single Logic rule so that no order is placed unless every condition agrees on the same bar.
| Step | Rule(s) Required | Description | Key Configuration |
|---|---|---|---|
| Data | Price Data | Load 15-minute US500 candles as the base series for every downstream rule. |
|
| Entry | Volume Data | The primary trigger. Fires only when the current bar’s traded volume reaches 2.0× its 20-period average — the evidence that resting liquidity was consumed rather than tested. |
|
| Entry | Price Level | Confirms price has actually closed beyond the consolidation boundary, not merely wicked through it. |
|
| Filter | Highest Price & Lowest Price | Define the consolidation range from the prior 20 bars and feed those boundaries into the Price Level rule. |
|
| Filter | Difference Between & Compare Values | Calculate range width and arm the setup only while the range is compressed below 1.2× ATR(14). |
|
| Filter | Candle Pattern | Final confirmation that the breakout bar held its extension into the close rather than spiking and retreating. |
|
| Filter | Logic | AND gate combining volume spike, boundary break, compression and candle pattern so a signal fires only on full agreement. |
|
| Risk | ATR & Place Trade | Size the position from realised volatility so risk stays constant in currency terms across quiet and active sessions. |
|
| Exit | Stop Loss & Take Profit | Bracket every position on entry, with a secondary exit if price closes back inside the range. |
|
| Backtest | Validate across compressed and trending regimes before committing capital. |
|
Backtest Considerations
Test this strategy across a minimum of twelve months of 15-minute US500 data, and make sure the window spans more than one volatility regime. A volume-spike breakout system behaves very differently in a low-VIX grind, where qualifying setups are rare and the ones that fire tend to follow through, than in a high-volatility repricing period, where the 2.0× threshold is hit constantly and a much larger share of those breakouts reverse. A backtest that covers only one of those environments will give you a confident number and a misleading one. Pay particular attention to how many setups the compression filter rejects — if it is rejecting fewer than half of all boundary breaks, the 1.2× ATR ceiling is too loose for the period you are testing.
The metrics that matter here are profit factor above 1.3, maximum drawdown you can actually tolerate in live trading, and — critically for a low-frequency system — the distribution of trades across the test period. Two to four setups per session sounds like a reasonable sample until you discover that 60% of the profitable trades clustered into six weeks of elevated volatility. Review the equity curve for flat stretches as well as drawdowns, and check the trade-count-per-month histogram before drawing conclusions about consistency. The Arconomy backtesting documentation covers how fills, bar sequencing and intrabar stop resolution are modelled, which materially affects results for a strategy that enters on bar close and brackets immediately.
Cost assumptions deserve care on the US500. Index CFD and futures spreads are typically tight during US cash hours — often well under a point — but they widen materially in the overnight session and around the cash open, which is precisely when volume spikes are most common. Model a realistic spread for the session you intend to trade rather than a single average, and add slippage on entry: a bar printing 2.0× average volume is by definition a fast bar, and the fill you get on the close of that bar will not always be the close you see on the chart. Assuming one to two points of combined spread and slippage per side on the US500 is a conservative starting point that keeps the backtest honest.
Key Takeaways
- The edge is not the breakout — it is the volume confirmation that separates genuine participation from a stop-run probe, with the breakout bar required to print at least 2.0× its 20-period average volume.
- Confluence matters because each filter removes a different failure mode: compression below 1.2× ATR(14) ensures a tight stop cluster, the Price Level break confirms a close beyond the boundary, and the Marubozu or Engulfing candle proves the extension held into the close.
- Risk 1–2% per trade with a 1.5× ATR stop and 3.0× ATR target, recalculating position size every trade because US500 ATR can double between a quiet session and an event week.
- Stand down when a range stays compressed for more than 40 bars without a volume print, when a signal fires within fifteen minutes of a headline or scheduled release, and after two losing trades in a session.
- Backtest across at least twelve months spanning multiple volatility regimes, and check the trade distribution over time — a low-frequency system whose profits cluster into a few weeks has not been validated, only sampled.
Credits
The strategy idea originated from the following YouTube channel. Concepts have been adapted and structured for systematic implementation by Arconomy.
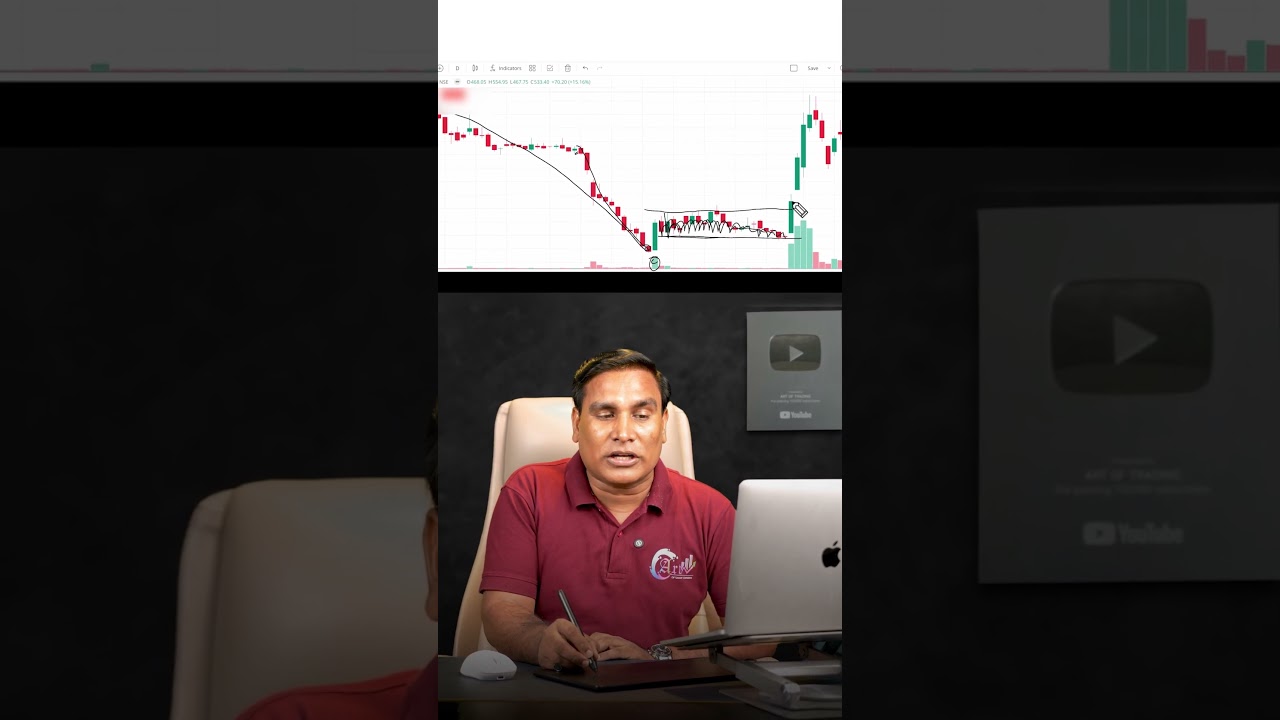
Art of Option Learning’s video makes the case that volume in isolation proves nothing — that a volume reading only becomes tradeable when it arrives alongside a breakout from a prior consolidation — and that three-part combination of consolidation, breakout and volume expansion is exactly the sequence this strategy encodes as the compression filter, the Price Level break and the 2.0× volume trigger.