News Catalyst
Brent crude (XBRUSD) sits at the centre of today’s geopolitical crosscurrents. Headlines confirm that Trump’s war in Iran remains active even as US–Iran peace-deal hopes tug prices the other way. This push-and-pull over Middle East supply risk is exactly the kind of two-sided news flow that inflates intraday range without committing to a sustained trend — oil spikes on escalation rhetoric, then fades as de-escalation chatter returns. With no high-impact scheduled releases on today’s economic calendar to anchor a direction, the price action is being driven by competing headlines, producing the sharp band-tagging extensions and snap-backs that a Bollinger Band mean-reversion system is designed to harvest.
Trade Summary
This strategy fades statistically stretched moves back toward the mean on Brent crude rather than chasing the headline-driven spikes. It uses the Bollinger Bands to define when price has travelled an abnormal distance from its 20-period moving average, then waits for a candlestick reversal at the band before entering a counter-move trade targeting the middle band. It is a fundamentally neutral, two-sided system: it sells the upper band and buys the lower band with equal conviction.
The edge is at its best in range-bound or news-chopped markets — precisely the conditions today’s competing Iran headlines are creating — where volatility is elevated but no durable trend has formed. A volume check confirms that the band tag came on a genuine liquidity flush rather than a slow drift, and the ATR sets a volatility-scaled stop so the system survives the occasional violent breakout that mean-reversion setups inevitably face.
The Anatomy of the Trade
The Logic: What Inefficiency Are We Exploiting?
Markets routinely overreact to news in the short term. When a fresh Iran escalation headline hits, Brent can gap and run well beyond its recent average price as stops cascade and momentum traders pile in — but with no confirmed change in physical supply, much of that move is emotional overshoot rather than repricing. Bollinger Bands quantify that overshoot: when price closes outside the upper or lower band, it has moved roughly two standard deviations from its 20-period mean, a statistically rare event that tends to revert.
The real edge comes from confluence. A band tag alone is not a signal — in a strong trend price can ride the band for dozens of bars. By demanding a candlestick reversal pattern (a pin bar or engulfing candle) and a volume spike at the band, we filter out the genuine breakouts and isolate exhaustion moves where buyers or sellers have run out of fresh participants. The candlestick confirmation is what converts a passive statistical observation into an actionable, timed entry.
Setup Requirements
- Primary indicator: Bollinger Bands set to a 20-period moving average with 2.0 standard-deviation bands.
- Confirmation: a reversal candlestick pattern (bullish/bearish engulfing or pin bar) closing at or beyond the relevant band.
- Volume filter: a volume reading at least 1.5× the 20-bar average, marking a liquidity flush at the extreme.
- Risk management: ATR (14-period) to size the stop relative to current volatility.
- Primary symbol: XBRUSD (Brent crude) — its sensitivity to Middle East headlines produces frequent, well-defined band excursions ideal for fading.
- Timeframe: 15-minute charts, which give enough price action for reliable band and volatility readings while keeping trades within a single session.
- Adaptability: the same rule set transfers to other liquid, news-sensitive instruments such as WTI crude, gold (XAUUSD), or major FX pairs — recalibrate the volume threshold per instrument.
Entry Rules
All conditions must align before a trade is taken — a band tag without confirmation is ignored.
- Long entry: price closes below the lower Bollinger Band and a bullish reversal candle prints and volume exceeds 1.5× its 20-bar average.
- Short entry: price closes above the upper Bollinger Band and a bearish reversal candle prints and volume exceeds 1.5× its 20-bar average.
Enter at the close of the confirmation candle, not on the bar that first touched the band.
Exit Rules
- Take profit: the 20-period middle band (the moving average), which is the statistical mean the trade is reverting toward.
- Stop loss: 1.5 × ATR beyond the entry, placed past the band extreme to allow for normal overshoot.
- Secondary exit: close the trade if price tags the opposite band before reaching the mean, or after a maximum hold of 4 hours.
The ATR stop is non-negotiable: mean-reversion strategies make many small wins and the occasional large loss, so a breakout that runs against you must be cut without hesitation.
Risk Management
- Risk per trade: 1–2% of account equity, never more.
- Risk-to-reward ratio: minimum 2:1 — only take setups where the distance to the middle band is at least twice the ATR stop distance.
- Position sizing: with a $25,000 account risking 1% ($250) and a 1.5 × ATR stop of $0.50 on Brent, size the position at 500 units ($250 ÷ $0.50).
- Maximum concurrent positions: one open XBRUSD trade at a time to avoid stacking correlated oil exposure during a single news event.
// Add this as a Strategy Note in the Arconomy Strategy Builder
// See: /docs/rules-library/working-with-rules

SYMBOL:      XBRUSD (Brent Crude)
TIMEFRAME:   15m

LONG ENTRY:
  close < lower Bollinger Band (20, 2.0)
  AND bullish reversal candle (engulfing / pin bar)
  AND volume > 1.5 × 20-bar average

SHORT ENTRY:
  close > upper Bollinger Band (20, 2.0)
  AND bearish reversal candle (engulfing / pin bar)
  AND volume > 1.5 × 20-bar average

TAKE PROFIT: middle band (20-period MA)
STOP LOSS:   1.5 × ATR(14) beyond entry
TIME EXIT:   4 hours max hold
             // Or opposite band tagged first

RISK:        1-2% equity, min 2:1 reward-to-risk
Common Pitfalls
Mean reversion is profitable on average but punishing when misapplied. Avoid these recurring mistakes.
Fading a Genuine Trend
The single biggest killer of band-fade strategies is shorting strength in a market that is genuinely trending. In a strong directional move, price will walk the outer band for many bars and every counter-trade becomes a loss. The volume filter and candlestick confirmation exist precisely to keep you out of these conditions — if they are not both present, stand aside.
Trading Through High-Impact Oil News
Brent is acutely sensitive to OPEC+ announcements, EIA inventory data, and Middle East escalation headlines. A mean-reversion entry taken seconds before a supply-shock headline can be run over instantly, blowing through the ATR stop on a gap. Check the calendar and the newswire before entering, and avoid fresh trades in the minutes around scheduled inventory releases.
Relaxing the Entry Filters
After a string of clean wins it is tempting to take the band tag without waiting for the reversal candle or volume spike. Every condition you drop converts the system from a selective edge into a coin flip. The rules are a package — trade them in full or not at all.
Over-Optimising the Band Settings
Tuning the standard-deviation multiplier and lookback period until the backtest looks perfect is curve-fitting. A strategy that only works at exactly 2.1 standard deviations and 19 periods is fitted to noise, not signal. Keep the parameters round and robust, and confirm they hold across multiple market regimes.
Revenge Trading After a Breakout Loss
Because losses tend to be larger than wins, a single breakout that stops you out can trigger the urge to immediately re-enter and “win it back.” Doubling down into a trending move is how a small drawdown becomes an account-ending one. Respect a daily loss limit and step away once it is hit.
Build Strategy using Arconomy
You can assemble this XBRUSD Bollinger Band Mean Reversion strategy in the Arconomy Strategy Designer without writing any code. Each step below maps to a rule in the rules library.
| Step | Rule(s) Required | Description | Key Configuration |
|---|---|---|---|
| Data | Price Data | Feed 15-minute XBRUSD candles into the strategy. |
|
| Entry | Bollinger Bands | Detect when price closes outside the upper or lower band — the core mean-reversion trigger. |
|
| Entry | Candle Pattern | Require a reversal candle at the band to confirm exhaustion. |
|
| Filter | Volume Data | Confirm the band tag came on a liquidity flush, not a slow drift. |
|
| Risk | ATR | Size the stop relative to current volatility. |
|
| Exit | Take Profit | Target the middle band (20-period mean) and enforce the 2:1 minimum reward. |
|
| Backtest | Validate across trending and ranging regimes before going live. |
|
Backtest Considerations
Test the strategy over a minimum of 12 months of 15-minute XBRUSD data so it spans multiple oil regimes — quiet range-bound stretches, OPEC-driven trends, and geopolitical volatility spikes like the current Iran tensions. Mean-reversion systems that look superb in a choppy quarter often bleed in a sustained trend, so the test window must include both to be trustworthy.
Watch the right metrics. A healthy mean-reversion system should show a profit factor above 1.3, a high win rate paired with a worst-case loss noticeably larger than the average win, and a maximum drawdown you could tolerate emotionally. Pay close attention to the trade distribution: if a handful of breakout losses dominate the equity curve, the ATR stop or the trend filter needs tightening.
Model costs honestly. Brent crude spreads widen sharply around news and the close, and slippage on a 1.5× volume entry can be material — build in a realistic spread and slippage assumption rather than the broker’s headline figure. Liquidity is thinnest in the late US/early Asian crossover, so consider restricting entries to higher-liquidity hours where fills are dependable.
Key Takeaways
- The core edge is fading statistically stretched Bollinger Band excursions on Brent crude back toward the 20-period mean.
- Confluence is everything — a band tag only becomes a trade when a reversal candle and a volume spike both confirm exhaustion.
- An ATR-scaled stop and a strict 1–2% risk cap are essential because mean reversion produces occasional outsized losses.
- Avoid the strategy in strong trends and around scheduled oil news, where band fades are most likely to be run over.
- Backtest across at least 12 months covering both ranging and trending regimes, and model realistic Brent spreads and slippage.
Credits
The strategy idea originated from the following YouTube channel. Concepts have been adapted and structured for systematic implementation by Arconomy.
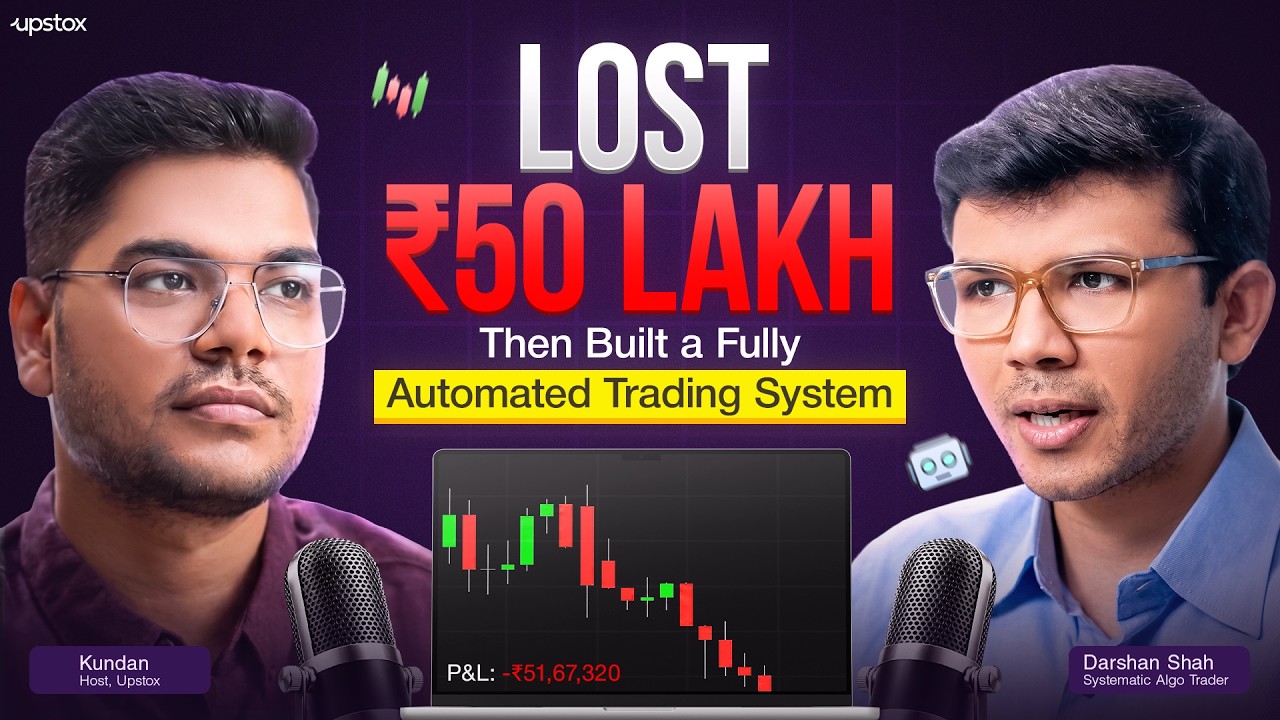
The Upstox video contrasts discretionary and systematic trading and argues that codifying entries into mechanical, repeatable rules is what separates consistent traders from the losing majority — the exact principle applied here by turning a subjective “price looks overextended” judgement into a precise Bollinger Band, candle-pattern, and volume rule set.