News Catalyst
US equity indices including the S&P 500 are sitting on the kind of headline-driven tape that suits a fast intraday system. Reuters reports that Merz says Europe wants a strong NATO and shares the US goal of ending the Iran war, while a parallel Reuters wire confirms the US and Iran are no closer to ending the conflict as Tehran's response is awaited, keeping geopolitical risk premium elevated. China's April energy import drop and decade-low fuel exports add a second risk-off cross-current that bleeds into US session opens. There are no high-impact economic releases on today's calendar, so price action is being driven entirely by headline flow — the perfect environment for a Stochastic-based intraday momentum system that thrives on short, decisive swings rather than trend persistence.
Trade Summary
This strategy uses the Stochastic Oscillator to time intraday momentum bursts on the US500 — entering when the oscillator turns up out of oversold territory or rolls down out of overbought, and exiting on the opposing signal or a fixed ATR-based stop. The core idea is simple: capture the snap-back move that follows an over-extended intraday push, take the meat of the swing, and step aside before the next reversal eats the open profit.
It is direction-agnostic, designed for the high-volatility, headline-driven sessions that index futures see when geopolitical risk dominates the tape. It performs best in choppy or rotational regimes where the index spends the day rejecting extremes rather than trending in one direction; it underperforms during sustained, low-noise trend days when Stochastic stays pinned at one extreme.
The Anatomy of the Trade
The Logic: What Inefficiency Are We Exploiting?
Intraday US500 price action on news-driven days tends to over-react in both directions. A headline pushes the index, momentum traders pile in, and the move runs further than the underlying flow justifies. The Stochastic Oscillator measures where the current close sits relative to the recent high-low range, and when the %K and %D lines cross out of an extreme zone they flag the moment that exhaustion turns into a counter-move. We are exploiting the mean-reverting tail of an over-extended momentum impulse.
The edge is not in calling the top or bottom — it is in waiting for the oscillator to confirm that buyers (or sellers) have lost control. By taking only the cross-back signal rather than the extreme reading itself, we filter out the trades where price stays pinned at the extreme and trends through us. The result is a setup that is wrong fast when it is wrong, and right with momentum when it is right.
Setup Requirements
- Primary indicator: Stochastic Oscillator with default settings (%K period 14, %D smoothing 3, slowing 3). Oversold threshold 20, overbought threshold 80.
- Confirmation: %K crosses %D after both lines have been inside the extreme zone — no entry on the first poke at the level.
- Risk management: 14-period ATR for stop placement and position sizing. Stop set at 1.5 × ATR from entry.
- Primary symbol: US500 (S&P 500 index). Deep liquidity, tight spreads, and consistent intraday volatility profile make it well-suited to oscillator-based timing.
- Timeframe: 5-minute or 15-minute charts during the US cash session. Short enough to capture intraday swings, long enough to filter the worst of the open-auction noise.
- Adaptability: Translates well to NDX/NAS100, DAX, and large-cap single names with similar liquidity. Avoid thinly-traded products where oscillator whipsaws dominate.
Entry Rules
All conditions below must align on the same closed bar before entry. There is no anticipation — wait for the bar to print.
- Long entry: Stochastic %K and %D both inside the oversold zone (< 20) on a prior bar and %K crosses above %D on the signal bar and the signal bar closes higher than the previous bar.
- Short entry: Stochastic %K and %D both inside the overbought zone (> 80) on a prior bar and %K crosses below %D on the signal bar and the signal bar closes lower than the previous bar.
Enter at the close of the confirmation candle. Skip the trade if the confirmation bar's range is more than 2 × ATR — the move has already happened.
Exit Rules
- Stop loss: 1.5 × ATR from entry, placed immediately on fill. Never moved against the trade.
- Take profit: Fixed 2:1 reward-to-risk target, or earlier exit if Stochastic crosses back into the opposing extreme.
- Time-based exit: Close any open position after 4 hours or before the US cash close, whichever comes first — intraday signals lose their edge if held overnight.
The stop is non-negotiable. The whole reason this setup has positive expectancy is that losers are cut at a fixed, pre-defined level — the moment that discipline slips, the edge evaporates.
Risk Management
- Risk per trade: 1% of account equity. Aggressive accounts may push to 2%, no higher.
- Risk-to-reward ratio: Minimum 2:1. Skip setups where the next obvious resistance/support sits inside 2R.
- Position sizing: Account $25,000, risk 1% = $250. ATR on US500 5m = 4.0 points, stop = 1.5 × 4.0 = 6.0 points. Position size = $250 ÷ 6.0 = ~41 micro-contracts (or fractional CFD equivalent).
- Maximum concurrent positions: One US500 position at a time. No pyramiding, no averaging into losers.
SYMBOL:     US500
TIMEFRAME:  5m or 15m (US cash session)

LONG ENTRY:
  Stochastic %K & %D < 20 on prior bar
  AND %K crosses above %D
  AND signal bar close > previous close

SHORT ENTRY:
  Stochastic %K & %D > 80 on prior bar
  AND %K crosses below %D
  AND signal bar close < previous close

STOP LOSS:   1.5 × ATR(14) from entry
TAKE PROFIT: 2:1 minimum reward-to-risk
             // Or Stochastic reaches opposite extreme
TIME EXIT:  Close after 4 hours or at US cash close

RISK:       1% of equity per trade
MAX OPEN:   1 position
Add the pseudo-code above as a Strategy Note in the Arconomy Strategy Builder so the rule set is documented alongside the build.
Common Pitfalls
The Stochastic-cross setup looks mechanical on a clean backtest chart, but the live tape rewards discipline far more than the indicator itself. The five mistakes below account for the majority of underperformance versus the modelled edge.
Trading Stochastic in a Trending Market
The single biggest failure mode is taking oversold-bounce signals during a sustained downtrend (or overbought-fade signals in a strong uptrend). On trending days the oscillator stays pinned at one extreme and every cross is a counter-trend trap. If the index has moved more than 2% in one direction during the session, stand aside — the regime is wrong for this setup.
Front-Running the Cross
Entering as %K approaches %D, before the actual cross prints, feels like getting a better fill but destroys the edge. The cross is the confirmation that exhaustion has occurred — without it, you are guessing. Wait for the bar to close.
Ignoring Scheduled News
Even though today's calendar is quiet, the strategy can be blown up by an unscheduled headline. Geopolitical wires around the Iran war or NATO are landing without warning and creating 1-2% candles in seconds. Either close positions ahead of known wire windows or accept that one bad headline can take a multi-R stop.
Curve-Fitting the Stochastic Inputs
The defaults (14, 3, 3) are robust across instruments and timeframes for a reason. Tuning the look-back to maximise backtest profit on US500 5m almost always degrades out-of-sample performance. Treat the parameters as fixed and let the trade-management rules carry the optimisation work.
Revenge Trading After a Whipsaw
Two false signals in a row is normal in chop. Three losers in a session is the hard stop — close the platform for the day. Most account blow-ups in oscillator systems come from the eighth trade after the third loss, not from the first three losses themselves.
Build Strategy using Arconomy
The US500 Stochastic Day Trading Strategy can be assembled in the Arconomy Strategy Designer using six rule blocks. The Stochastic logic is modelled with the RSI rule (Arconomy's general-purpose oscillator rule covers Stochastic, CCI, and other bounded indicators), with confluence enforced by a Logic gate before the trade fires.
| Step | Rule(s) Required | Description | Key Configuration |
|---|---|---|---|
| Data | Price Data | Subscribe to US500 5m price data for the live timeframe. |
|
| Entry | RSI (Stochastic mode) | Configure the oscillator rule to model Stochastic %K cross %D out of the extreme zones. |
|
| Filter | Logic | AND-gate the Stochastic cross with the signal-bar direction requirement so only confirmed reversal candles trigger. |
|
| Risk | ATR | Calculate stop distance as a multiple of ATR for dynamic, volatility-adjusted risk. |
|
| Exit | Place Trade | Submit market order with attached stop and 2R take-profit, plus a 4-hour time-based close. |
|
| Backtest | Run a full backtest across multiple market regimes before going live with real capital. |
|
Backtest Considerations
Backtest the system across at least 12 months of US500 5m data to capture both trending and rotational regimes. The Iran war headline cycle has dominated 2026 price action and skews the recent sample toward high-volatility outcomes — include 2024 and 2023 data so the test covers calmer macro periods as well. Expect signal frequency in the range of 2-4 trades per session.
Watch the standard backtesting metrics: profit factor above 1.3, max drawdown under 15% of starting equity, and a relatively flat distribution of trade outcomes (no single trade carrying more than 5% of total profit). A win rate near 45-55% is normal for this kind of mean-reverting oscillator system — the edge comes from the 2:1 reward-to-risk, not from being right most of the time.
Use realistic execution assumptions: 0.4 points of spread on US500 CFD (or one-tick on the e-mini), 0.5 points of slippage on entries during fast headline-driven moves, and a 1-bar delay on stop fills to avoid the optimistic "stop hit at exact price" backtest illusion. Liquidity is rarely a concern for US500 at retail size, but during the first 5 minutes of the cash open it is worth widening the slippage assumption to 1.0 points.
Key Takeaways
- The Stochastic cross-from-extreme triggers a high-quality reversal entry on US500 intraday charts when geopolitical headlines drive over-extended moves.
- Confluence between the oscillator cross and a confirmation candle close filters out the false signals that single-indicator systems suffer from.
- Risk is fixed at 1% per trade with a 1.5 × ATR stop and a 2:1 minimum reward-to-risk — the math works even at a 45% win rate.
- Stand aside on strong-trend days, around scheduled wire releases, and after three consecutive losing trades in a single session.
- A 12-month backtest covering both trending and rotational regimes is the minimum bar before committing live capital to this system.
Credits
The strategy idea originated from the following YouTube channel. Concepts have been adapted and structured for systematic implementation by Arconomy.
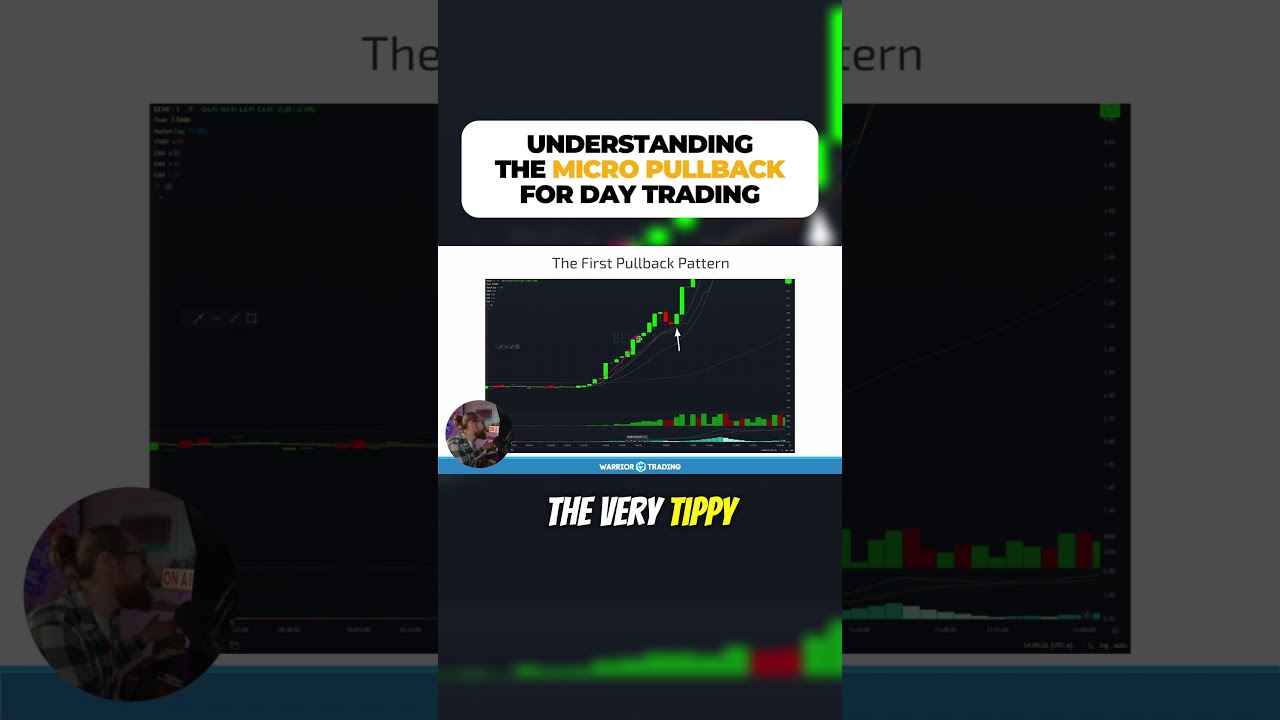
Ross Cameron of Warrior Trading walks through his preferred intraday momentum approach — using oscillator confirmation to time short-duration reversal trades on US equities — which directly informed how this post structures the Stochastic-cross signal and the fixed-R exit framework on US500.