Introduction
The 21-period Exponential Moving Average is one of the most widely tracked levels in day trading, and for good reason. This strategy uses the 21 EMA as a dynamic trend anchor on BTCUSD intraday charts, entering long when price reclaims the EMA with a bullish Hammer candlestick confirmation, and entering short when price rejects the EMA with an Evening Star formation. The approach is directionally neutral — it follows whatever trend the 21 EMA reveals — and is designed to perform best in trending or momentum-driven market conditions where price respects the moving average as dynamic support or resistance.
Bitcoin has been under intense scrutiny in late March 2026 as geopolitical tensions escalate. The ongoing conflict in Iran has sent oil prices surging, pushed the US dollar higher on safe-haven flows, and created sharp risk-off rotations across crypto markets. With Reuters reporting that President Trump’s approval rating has hit a new low of 36% amid fuel price spikes, macro uncertainty is translating directly into elevated Bitcoin volatility — precisely the environment where a trend-following EMA strategy captures outsized moves as institutional capital rotates rapidly between risk-on and risk-off positioning.
The Anatomy of the Trade
The Logic: What Inefficiency Are We Exploiting?
Intraday trends in BTCUSD tend to persist once established, because Bitcoin’s 24/7 market structure means there is no closing bell to reset sentiment. When price is trading above the 21 EMA, buyers are in control on the intermediate timeframe; when below, sellers dominate. The 21-period length sits in a sweet spot — responsive enough to track genuine momentum shifts within a session, yet slow enough to filter out the noise of individual candles. The EMA as a dynamic support/resistance level creates a zone where algorithmic and institutional orders cluster, making it a self-reinforcing level that traders can exploit.
The candlestick confirmation layer eliminates the most common failure mode of moving average strategies: whipsaws during consolidation. A Hammer candle at the EMA for long entries shows that sellers pushed price down to the average but buyers aggressively rejected that level within the same candle. An Evening Star at the EMA for short entries demonstrates a three-candle exhaustion pattern where a rally attempt into the average fails and reverses. This confluence of trend direction and price action structure dramatically improves the signal-to-noise ratio compared to trading every EMA touch blindly.
Setup Requirements
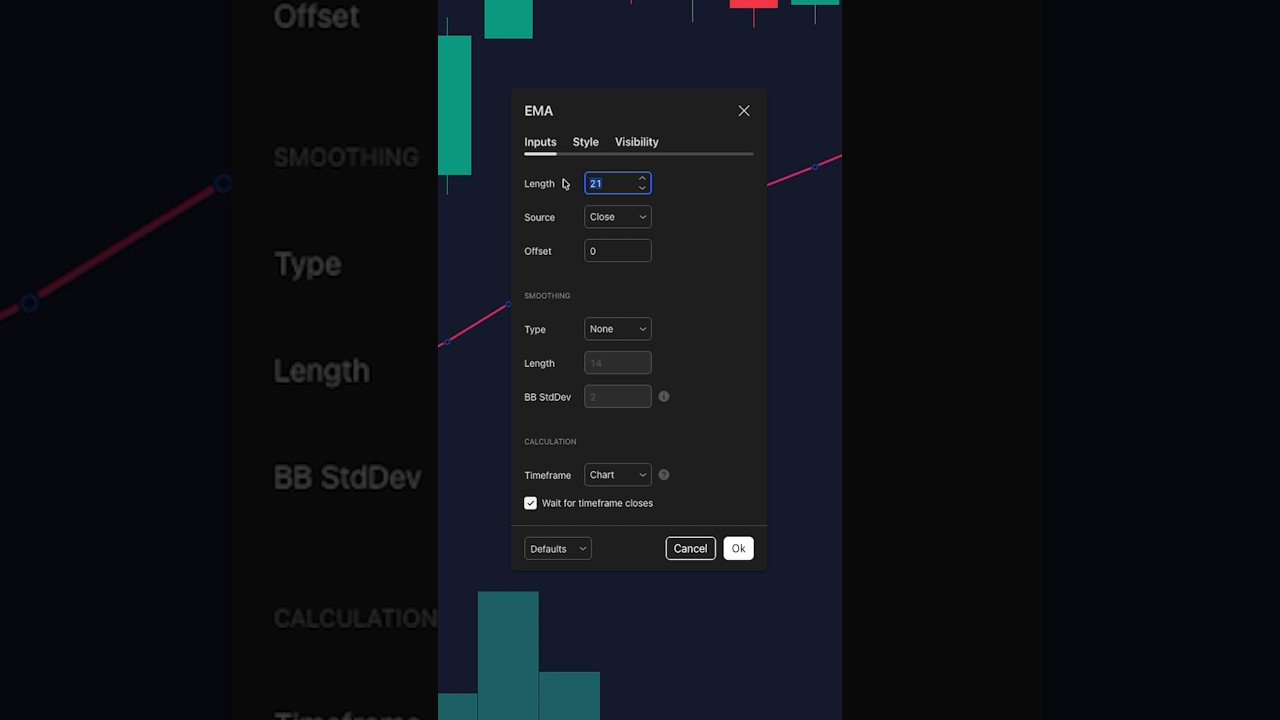
- Primary Indicator: Moving Average — 21-period EMA applied to the close price
- Long Confirmation: Hammer candlestick completing at or near the 21 EMA with the wick touching the average
- Short Confirmation: Evening Star three-candle formation completing at or near the 21 EMA
- Risk Management: ATR (14 periods) for volatility-adjusted stop placement
- Primary Symbol: BTCUSD — high volatility and strong intraday trends make it ideal for EMA-based momentum strategies, and current geopolitical events are driving elevated directional moves
- Timeframe: Day Trading (5m–15m charts) — captures intraday swings while giving the 21 EMA enough data to produce meaningful readings
- Adaptability: The same 21 EMA logic works well on other high-momentum instruments such as ETHUSD, US500, or XAUUSD during trending sessions
Entry Rules
All conditions must align before entering. A touch of the EMA without the candlestick pattern, or the pattern forming far from the EMA, is not a valid trade.
- Long Entry: Price pulls back to the 21 EMA from above and a Hammer candle completes with its lower wick touching or penetrating the EMA level
- Short Entry: Price rallies up to the 21 EMA from below and an Evening Star formation completes with the middle candle touching or penetrating the EMA level
Enter at the close of the confirmation candle. For the Evening Star this means waiting for the third candle to fully form. For the Hammer, wait for the candle to close — a long lower wick alone is insufficient until the candle has completed.
Exit Rules
- Stop Loss: 1.5 × ATR from the entry price, placed below the Hammer wick for longs and above the Evening Star high for shorts
- Take Profit: Minimum 2:1 reward-to-risk ratio, or the next significant swing high/low visible on the chart
- Secondary Exit: Price crosses back through the 21 EMA and closes on the opposite side for two consecutive candles, indicating the trend has reversed
The stop loss is non-negotiable. BTCUSD can move thousands of dollars in minutes during macro news events. An ATR-based stop ensures the position is sized relative to current volatility rather than an arbitrary dollar amount, protecting against gap-style moves while giving the trade enough room to breathe during normal price oscillation.
Risk Management
- Risk Per Trade: Maximum 1–2% of account equity per position
- Risk-to-Reward Ratio: Minimum 2:1, targeting 3:1 when the EMA touch aligns with a broader support/resistance zone
- Position Sizing: Calculate units as (Account Risk $) ÷ (1.5 × ATR in price). For example, with a $10,000 account risking 1% ($100) and a 14-period ATR of $500: $100 ÷ $750 = 0.133 BTC
- Maximum Concurrent Positions: 1 trade at a time on BTCUSD to avoid doubling exposure to the same directional move
SYMBOL:       BTCUSD

TIMEFRAME:    15m

LONG ENTRY:  Price pulls back to 21 EMA from above
              AND Hammer candle completes at EMA level

SHORT ENTRY: Price rallies to 21 EMA from below
              AND Evening Star formation completes at EMA level

STOP LOSS:   1.5 × ATR from entry

TAKE PROFIT: 2:1 minimum reward-to-risk
              // Or price closes through EMA on opposite side for 2 candles

RISK:        1-2% per trade, max 1 concurrent position
Copy the above rules into your Arconomy Strategy Designer. See Working with Strategy Notes for guidance on adding a Strategy Note to your rule set.
Common Pitfalls
EMA trend-following strategies on Bitcoin carry specific risk factors that differ from lower-volatility instruments. Recognising these failure modes in advance is essential to preserving capital.
Trading in Sideways Consolidation
When BTCUSD enters a tight range, the 21 EMA flattens and price whipsaws above and below it repeatedly. Every touch generates a false signal. If the EMA slope is flat and ATR is contracting, step aside entirely. This strategy requires a trending environment to generate edge — forcing trades during consolidation will produce a string of small losses that erode the account.
Ignoring Macro News Catalysts
Bitcoin is increasingly correlated with macro risk events. Fed rate decisions, geopolitical escalations like the ongoing Iran conflict, and major regulatory announcements can move BTCUSD by 5–10% in hours, overwhelming any technical setup. Check the macro calendar before each session. If a Tier 1 event is imminent, close open positions or avoid new entries — the EMA becomes irrelevant when price is driven by headline flow rather than technical momentum.
Chasing the First Touch After a Gap
Bitcoin trades 24/7 but liquidity thins dramatically during weekend hours and certain Asian session windows. After a low-liquidity price gap, the first touch of the 21 EMA often produces an unreliable reaction because the average itself has been calculated through thin data. Wait for at least 20 candles of normal-volume price action after any liquidity gap before trusting an EMA-based signal.
Over-Optimising the EMA Period
The 21-period EMA is popular precisely because it strikes a balance between responsiveness and stability. Optimising to 19 or 23 periods based on a particular backtest window is a classic curve-fitting mistake. The edge does not come from the exact period — it comes from the price action confirmation at a widely-watched level. Stick with 21 unless you have a structural justification that extends beyond recent performance.
Revenge Trading After Stop-Outs
Trend-following strategies produce clusters of losses during regime transitions — the market shifts from trending to ranging and several consecutive trades hit stops. The temptation to increase size on the next trade is powerful and destructive. After two consecutive losses, reduce position size to half for the next three trades. This drawdown circuit-breaker protects equity during the transition period and allows the strategy to recover naturally once a new trend establishes.
Watch the Build
See exactly how this strategy was built step-by-step in the Arconomy platform:
Build Strategy using Arconomy
The 21 EMA Day Trading Strategy can be assembled inside the Arconomy Strategy Designer using the following rule configuration — no coding required.
| Step | Rule(s) Required | Description | Key Configuration |
|---|---|---|---|
| Data | Price Data | Load BTCUSD price data with 15-minute candles to capture intraday trend movements around the 21 EMA |
|
| Entry | Moving Average Candle Pattern |
The 21 EMA identifies the intraday trend direction and dynamic support/resistance, while Hammer and Evening Star patterns confirm genuine reversal intent at the average |
|
| Risk | ATR Place Trade |
ATR scales stops to current BTCUSD volatility while a fixed R:R target ensures positive expectancy |
|
| Exit | Moving Average | Price closing through the 21 EMA on the opposite side for two consecutive candles signals a trend reversal and triggers an early exit |
|
| Backtest | Validate across both trending and ranging periods to confirm the strategy sits idle during consolidation and captures directional moves |
|
Backtest Considerations
Run this strategy across a minimum of six months of BTCUSD 15-minute data, ensuring the sample includes at least one sustained bull trend, one bear trend, and one extended consolidation phase. Bitcoin’s market structure shifted meaningfully through 2025–2026 with the maturation of spot ETF flows and macro correlation, so recent data is more relevant than pre-2024 samples. Testing only on trending windows will inflate results; the strategy should naturally reduce trade frequency during flat periods.
Key metrics to watch: profit factor should exceed 1.3 with realistic spreads and slippage modelled; maximum drawdown should stay below 15% of peak equity; and win rate should sit between 40–55% — this is a trend-following system that wins through favourable risk/reward ratios, not a high win-rate approach. Trade clustering is expected: the best months will produce several consecutive winners during strong trends, while ranging months will show small losses. Consult the Arconomy Backtesting Guide for methodology and metric benchmarks.
BTCUSD carries wider spreads than major forex pairs, particularly during low-liquidity Asian session hours. Model a minimum spread of $30–$50 for realistic backtest results and add $10–$20 of slippage per entry. Avoid backtesting during weekend hours where liquidity is thin and the EMA produces unreliable signals. If the backtest profit factor drops below 1.0 when spreads are doubled, the edge is too fragile for live deployment.
Key Takeaways
- The 21 EMA acts as a dynamic support and resistance level that institutional and algorithmic traders cluster around, creating a self-reinforcing zone for trend entries.
- Requiring Hammer or Evening Star candlestick confirmation at the EMA eliminates whipsaw trades during consolidation and dramatically improves signal quality.
- ATR-based stops sized at 1.5× ensure positions are protected against normal volatility while giving the trend room to develop toward the 2:1 minimum target.
- Avoid all entries when the 21 EMA is flat and ATR is contracting — this strategy is designed for trending conditions and will generate losses during sideways markets.
- Backtesting across at least six months of mixed market regimes is essential to validate that the edge persists through both trending and ranging environments before risking real capital.
Credits
Strategy sourced from SMB Capital on YouTube.